


This project holds Kotlin-based feature demonstrations for Source++, the continuous feedback platform for developers. These demonstrations are meant to be used as a reference for how to use Source++ in your own projects.
Install the Source++ plugin via the JetBrains Marketplace by searching for: Source++.
Alternatively, you can download the Source++ plugin directly
from here.
Once the plugin is installed, check out the demos below. Each demo contains instructions explaining how to use it.
Note
You do not need to run any code for these demos. This application is hosted on our publicly accessible servers.
Live Commands allow you to execute user-defined actions. These commands have access to application runtime data and can be used to gather metrics, trigger alerts, or perform other actions.
Command Preview
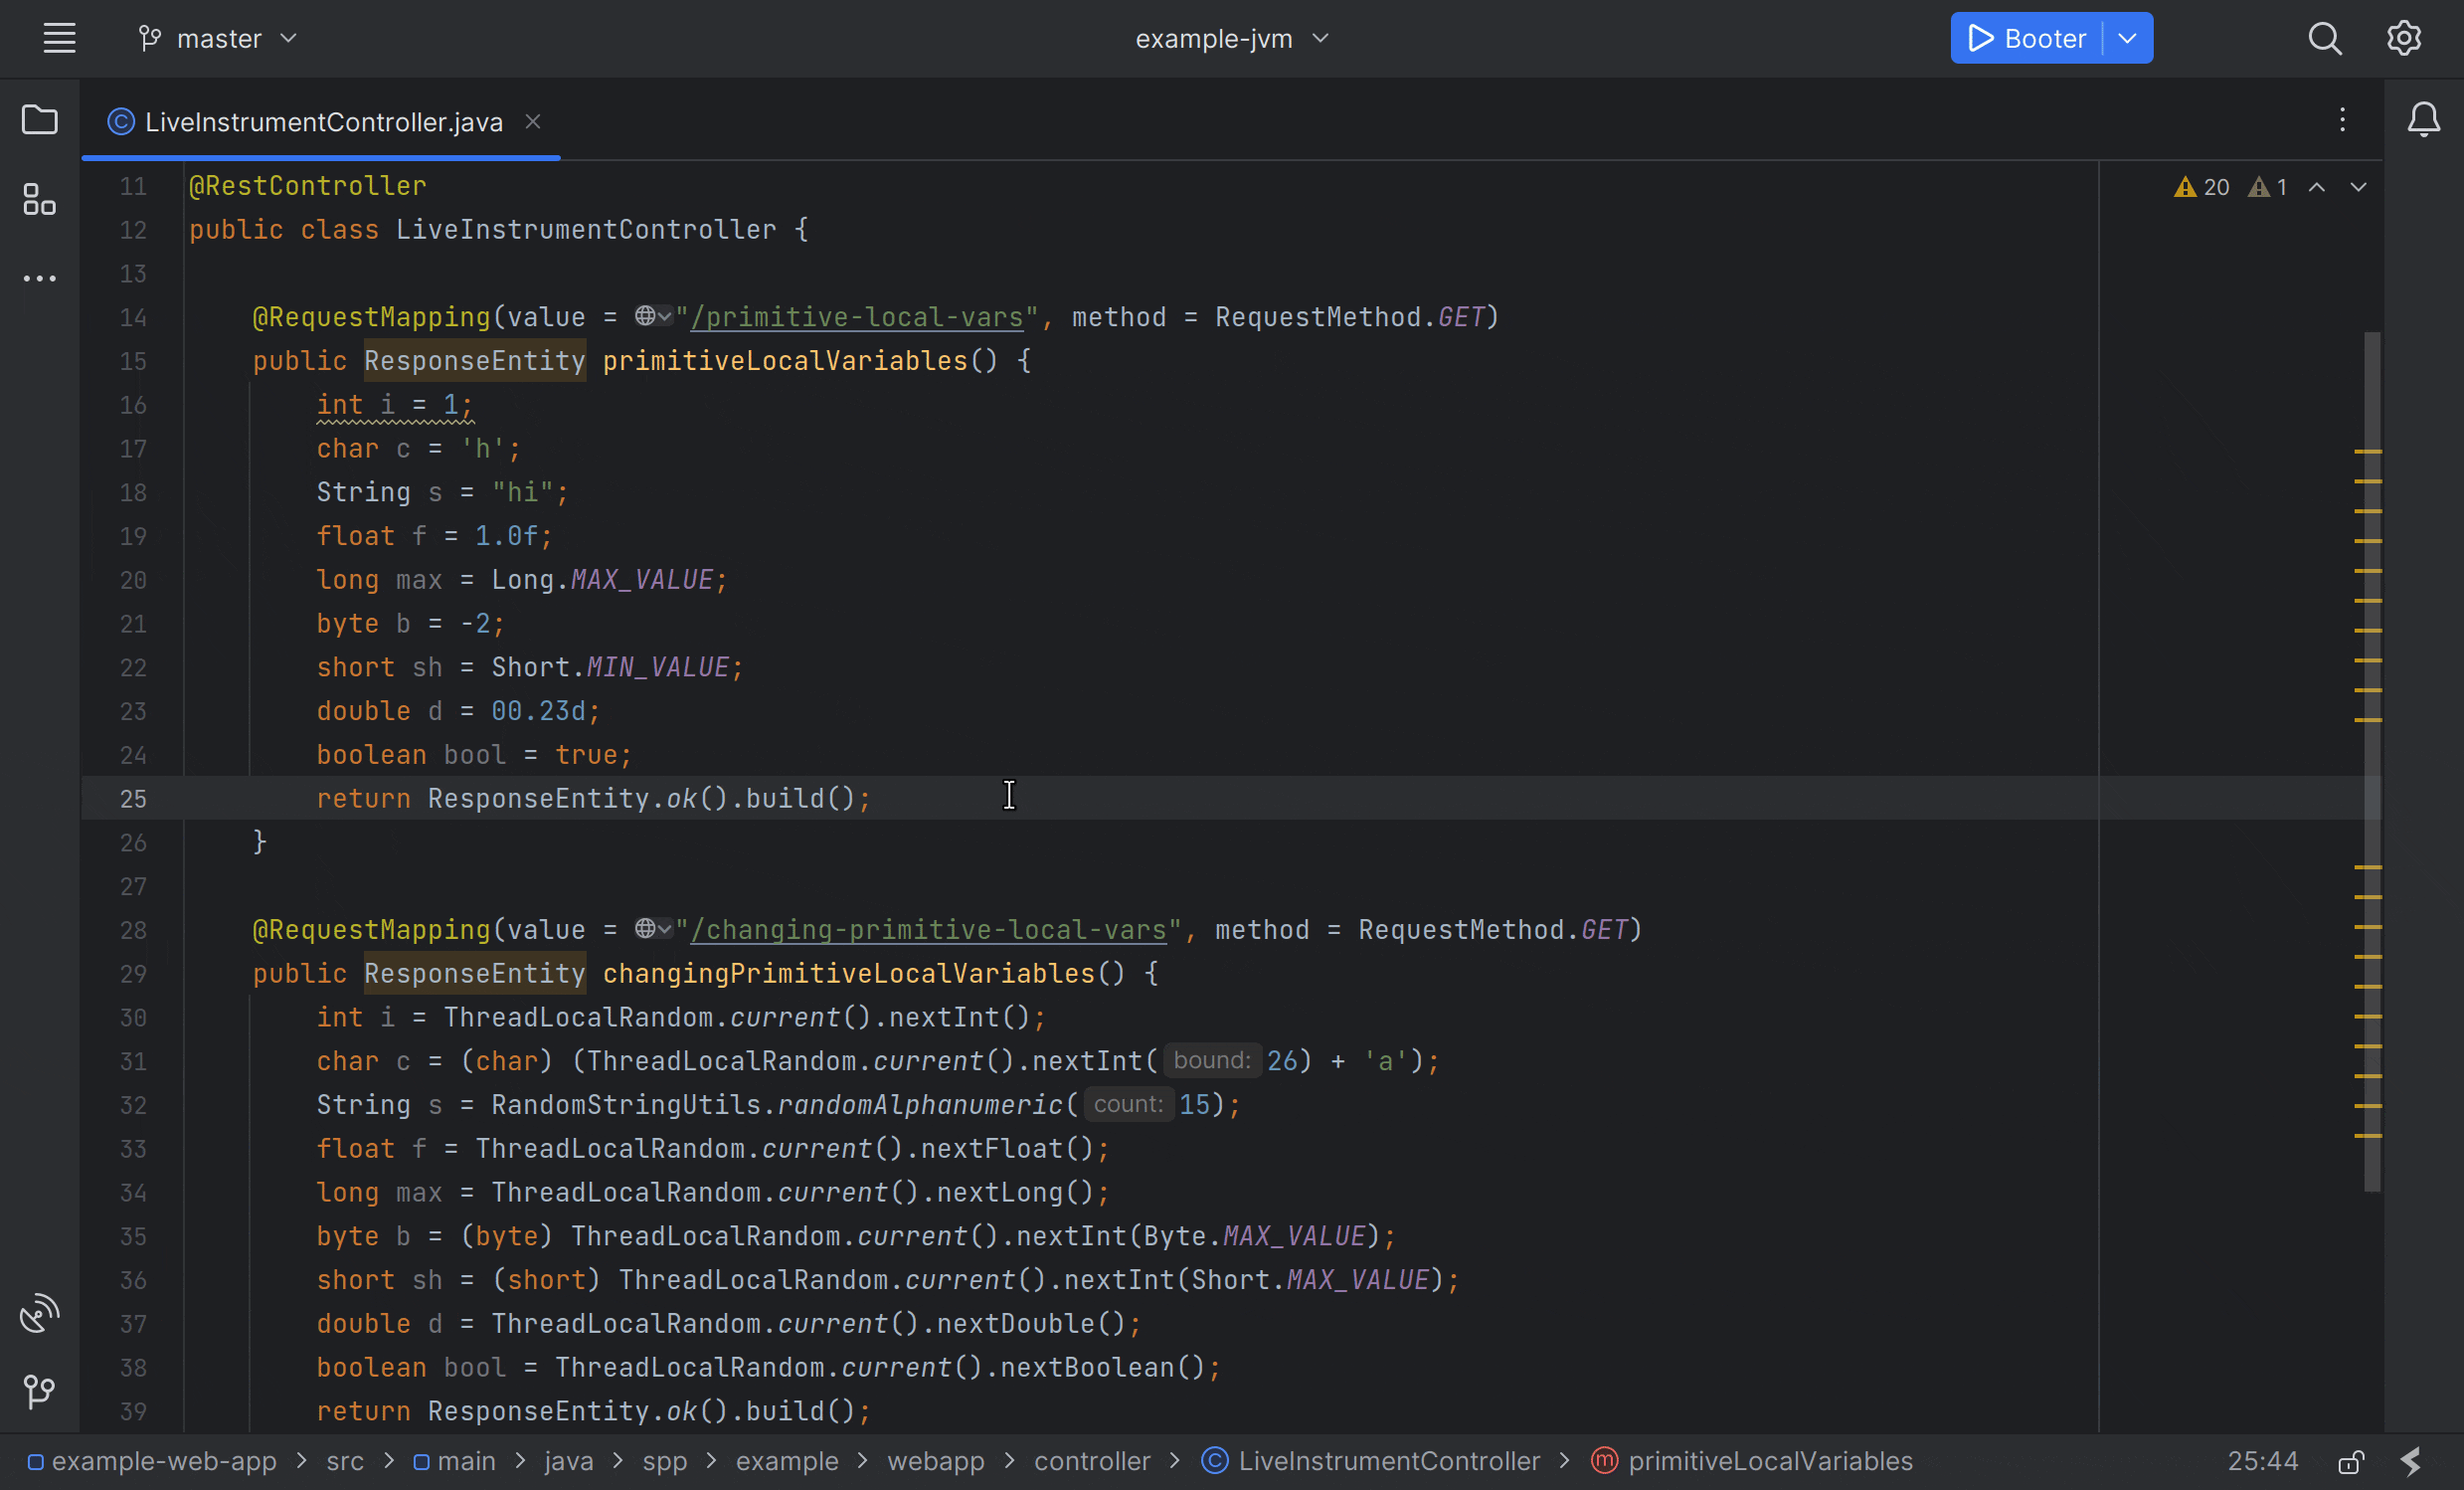
This demonstration shows how to add a "non-breaking breakpoint" to a running application. The Add Breakpoint command is useful for debugging production applications without impacting the end user.
Command Preview

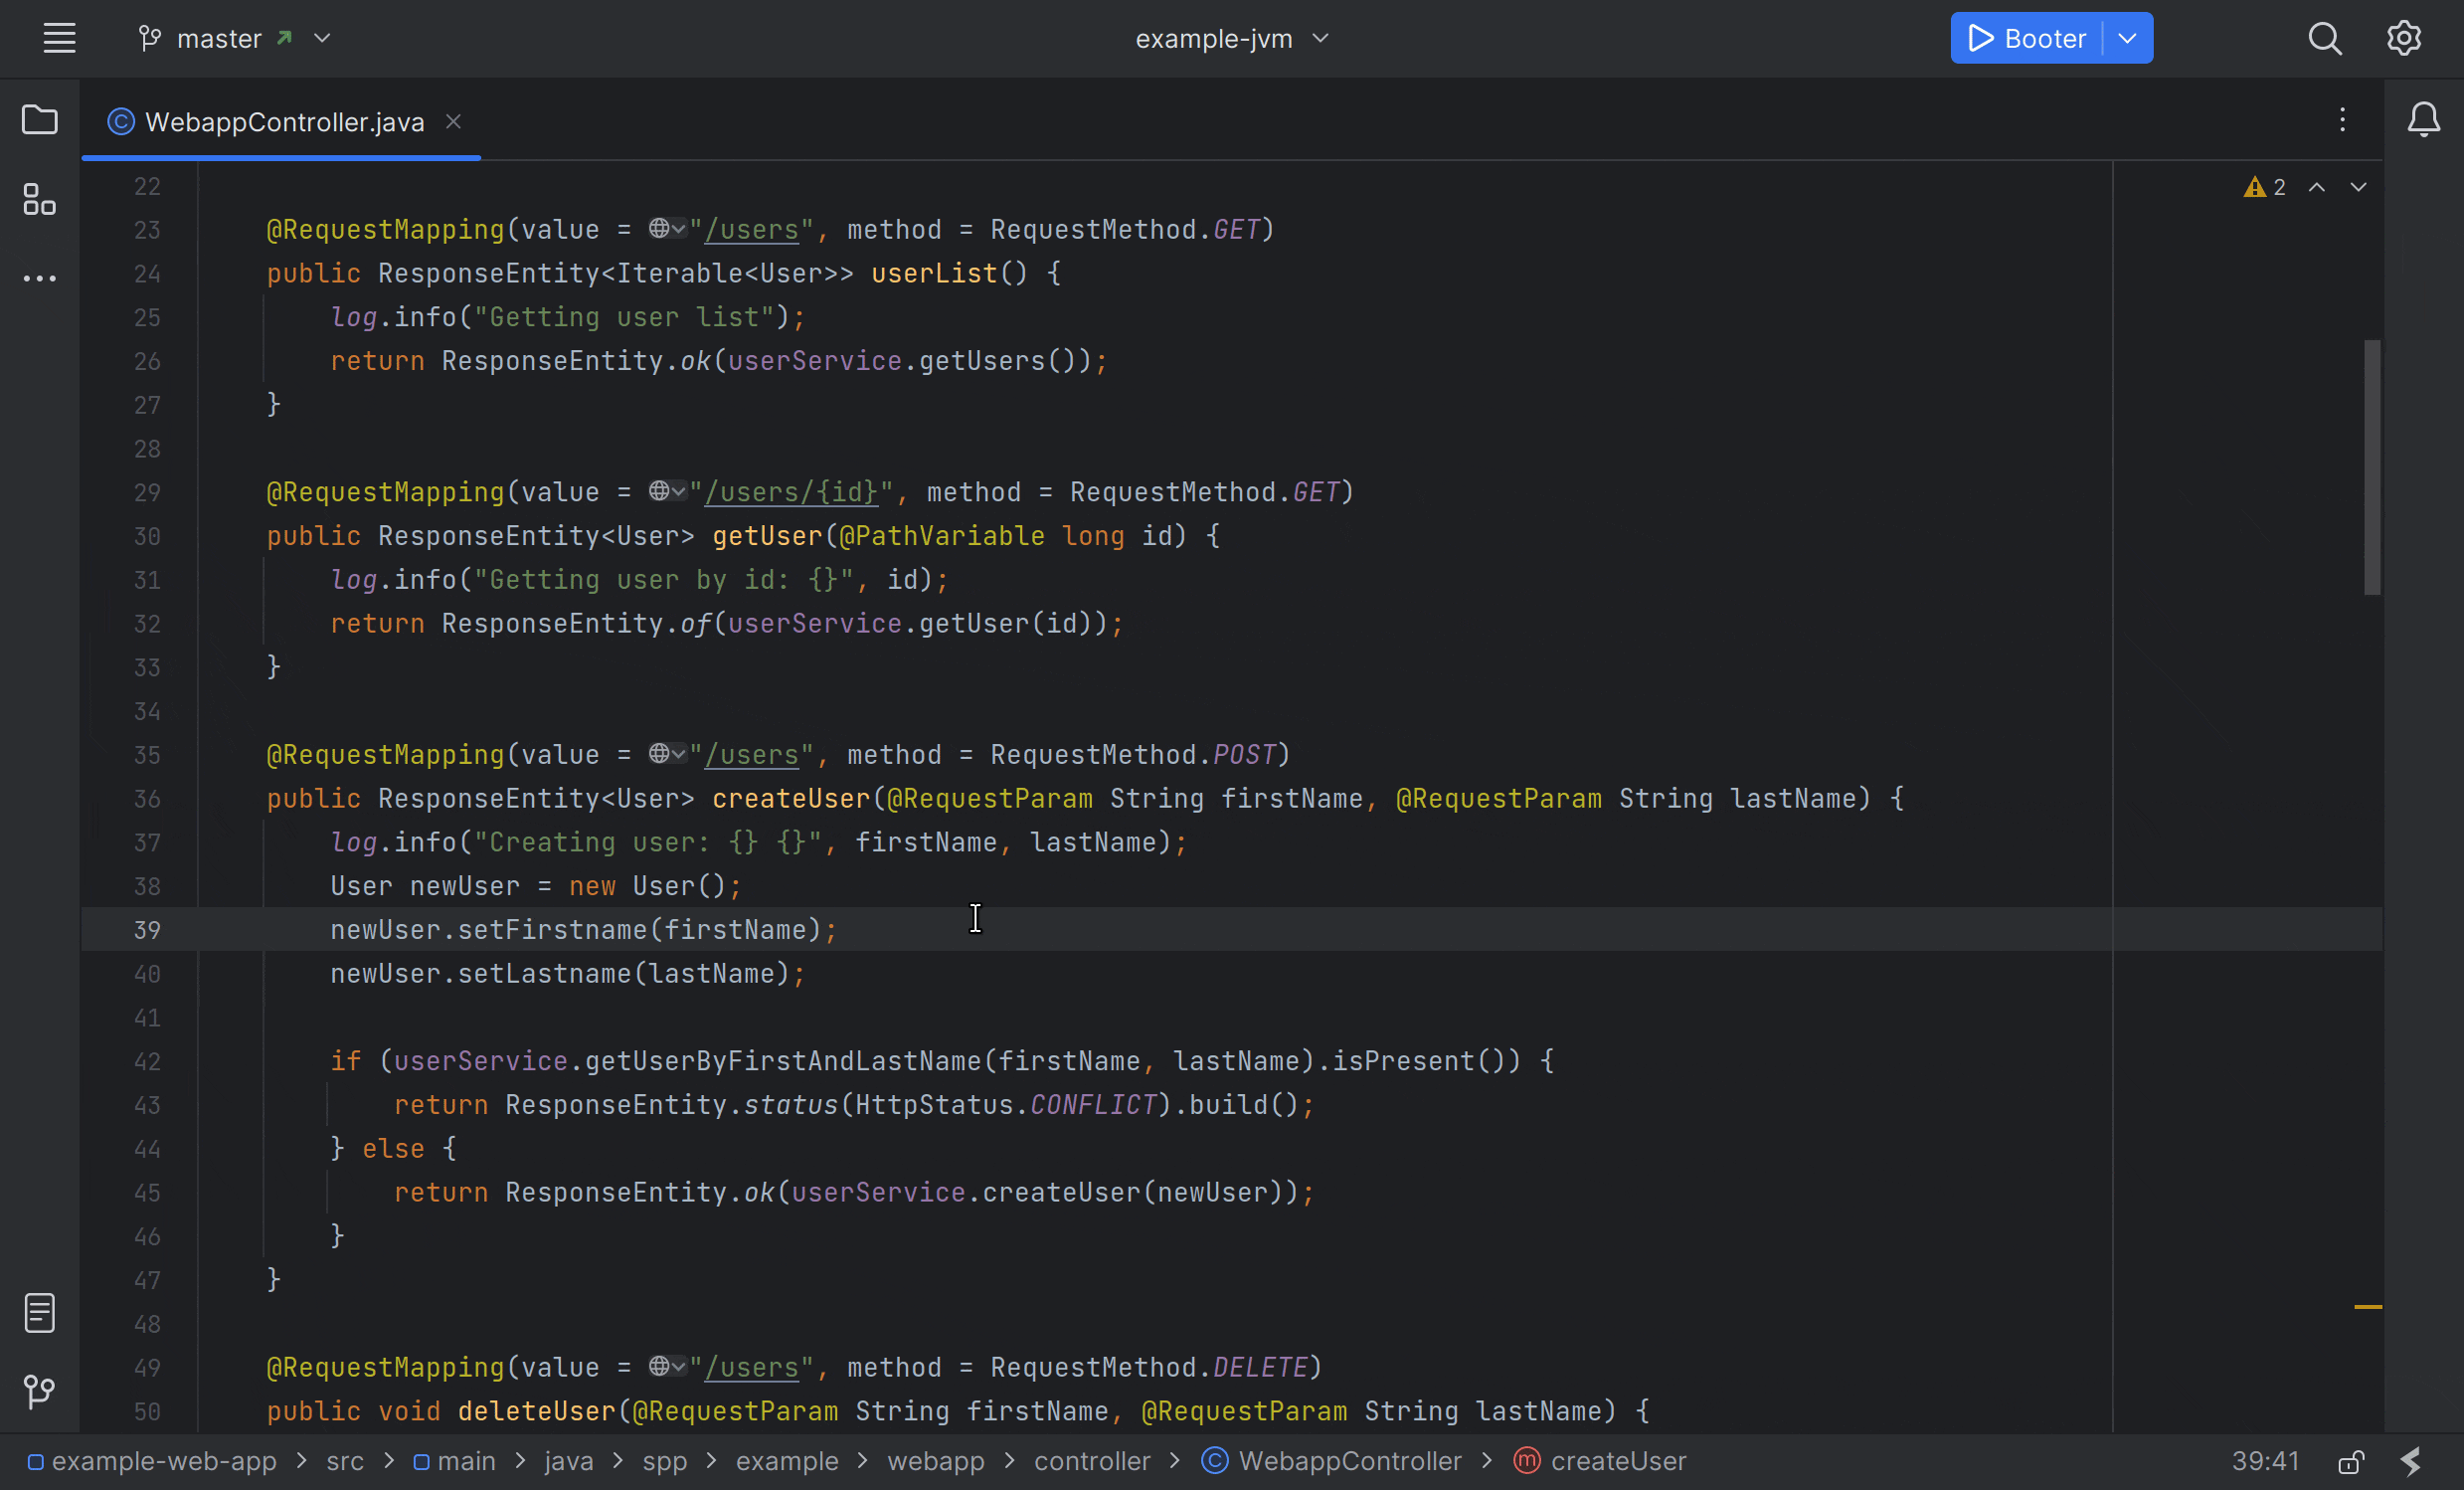
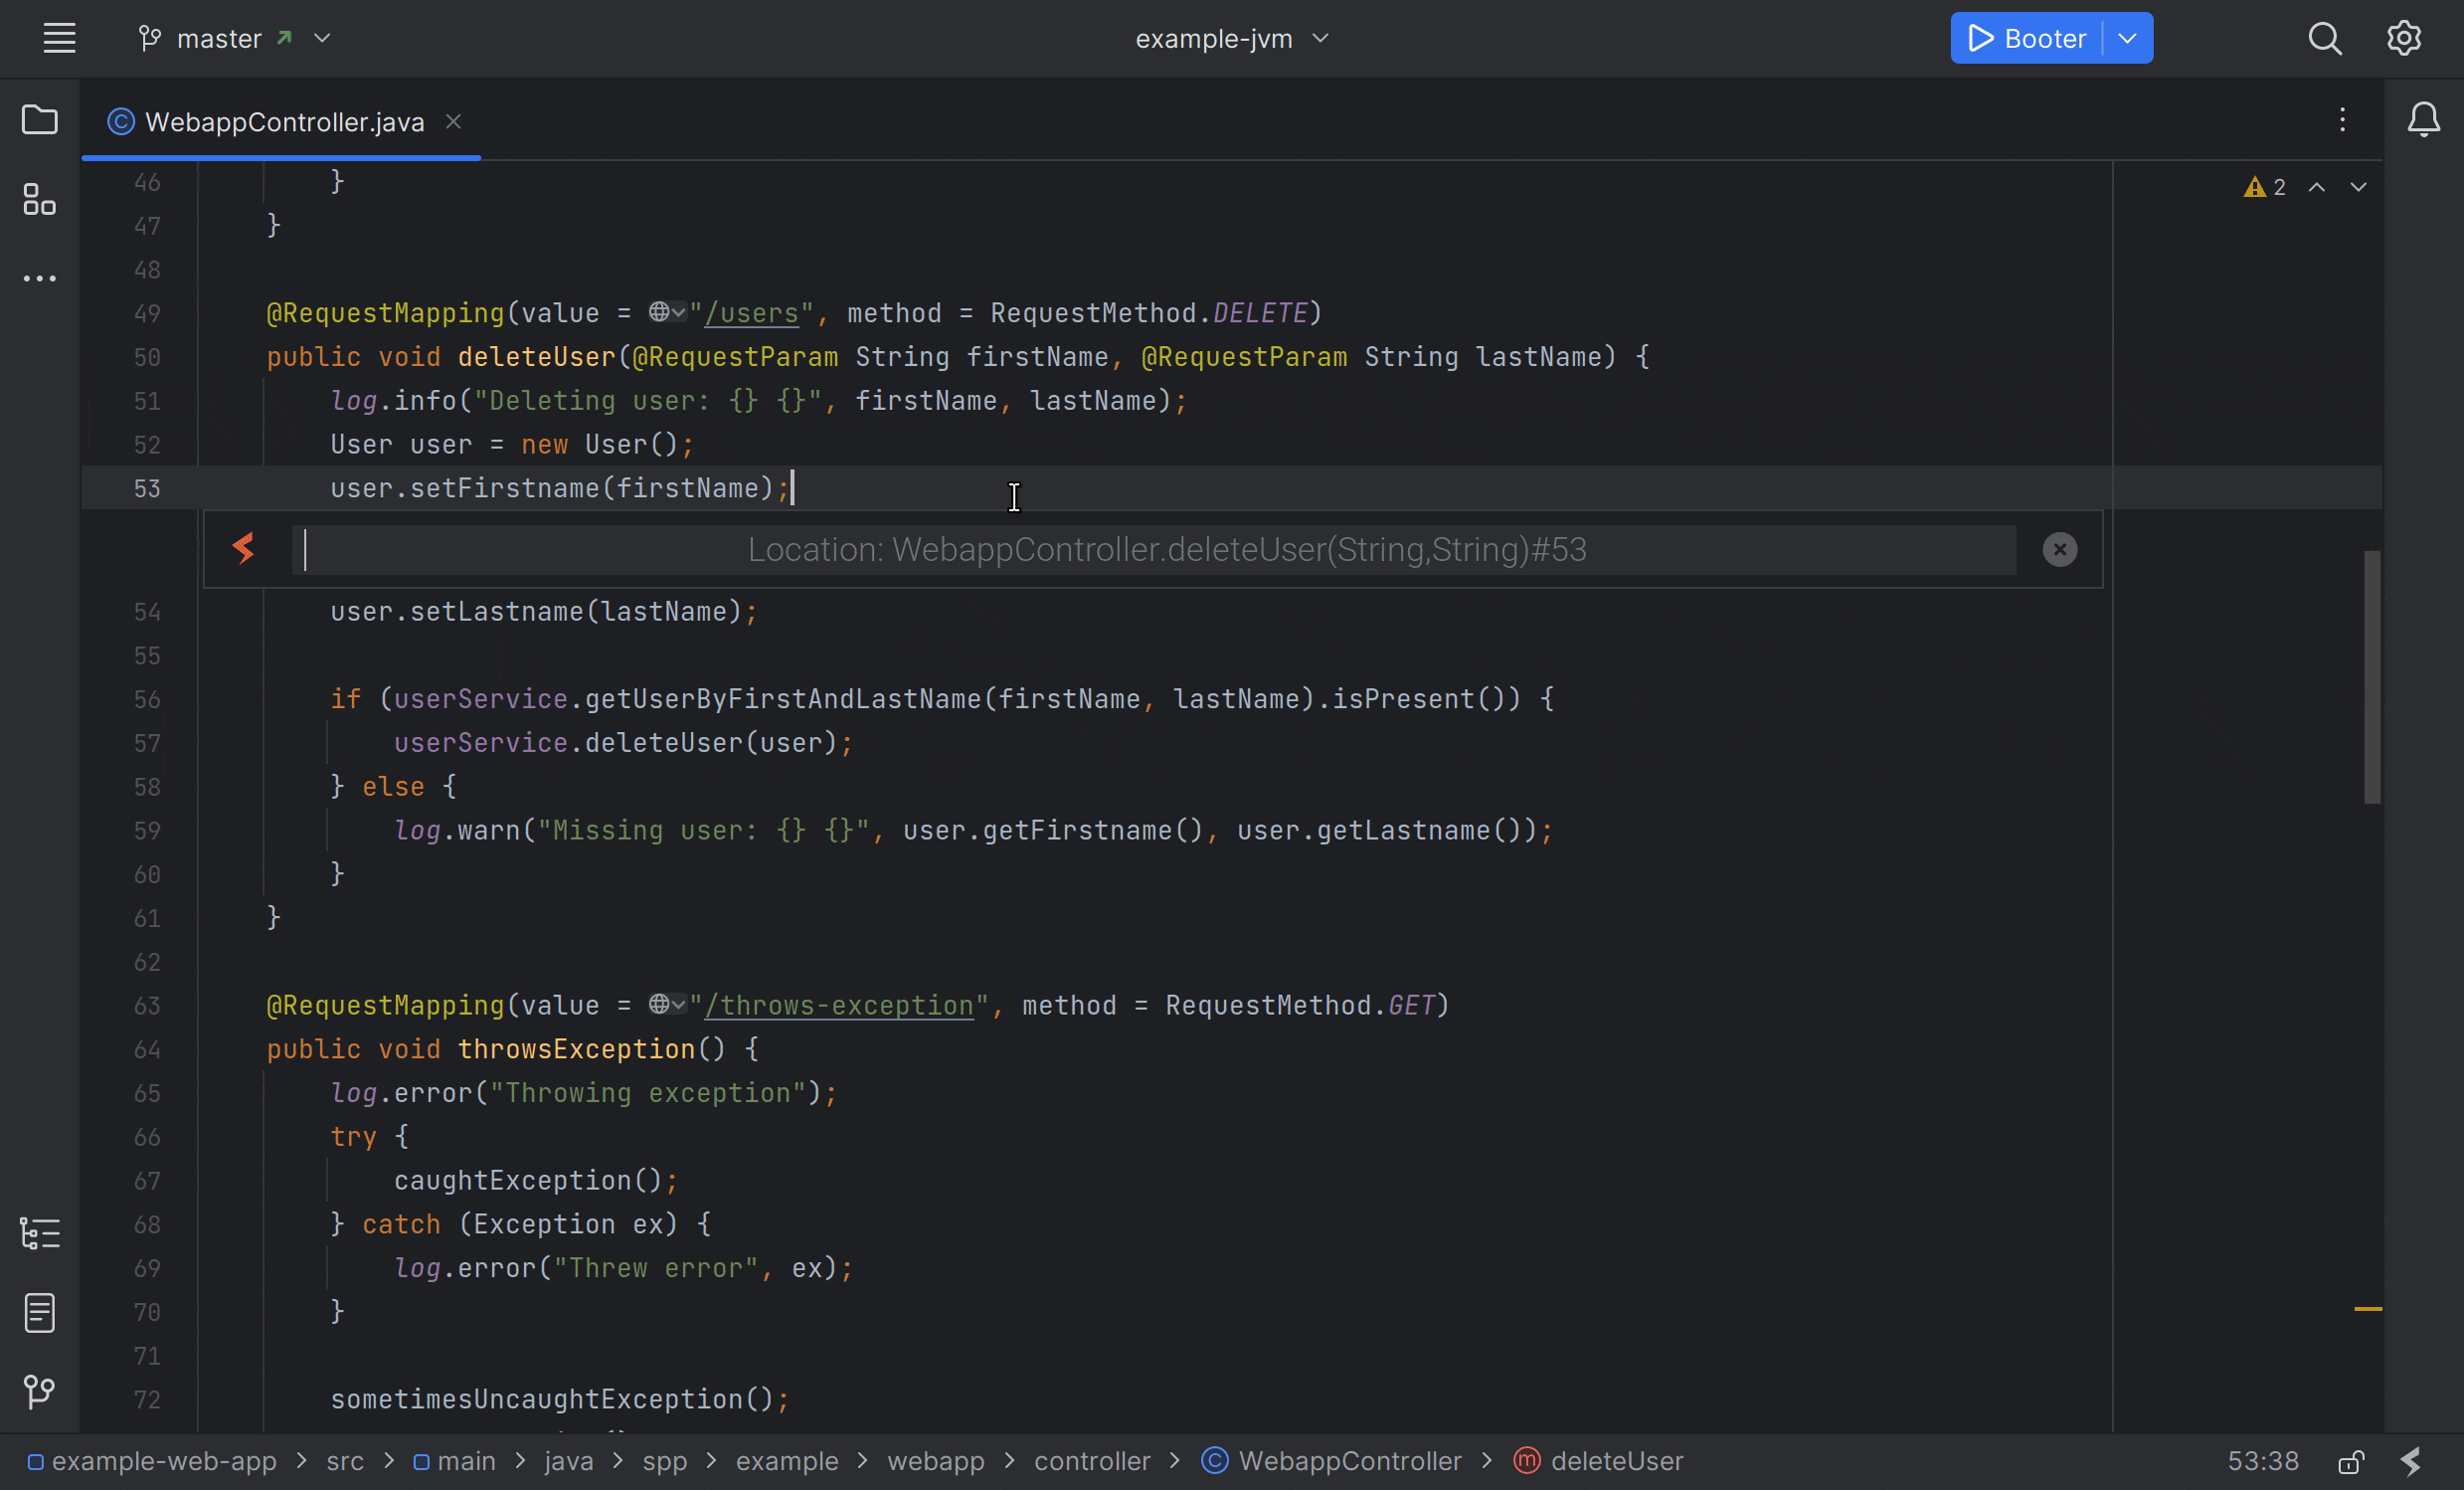
This demonstration shows how to add a log statement to a running application. The Add Log command is useful for increasing the verbosity of a running application with logs that output directly into the IDE.
Command Preview
This demonstration shows how to follow existing logs from a running application. The Tail Logs command works with most logging frameworks, including Log4j, Logback, and SLF4J.
Command Preview
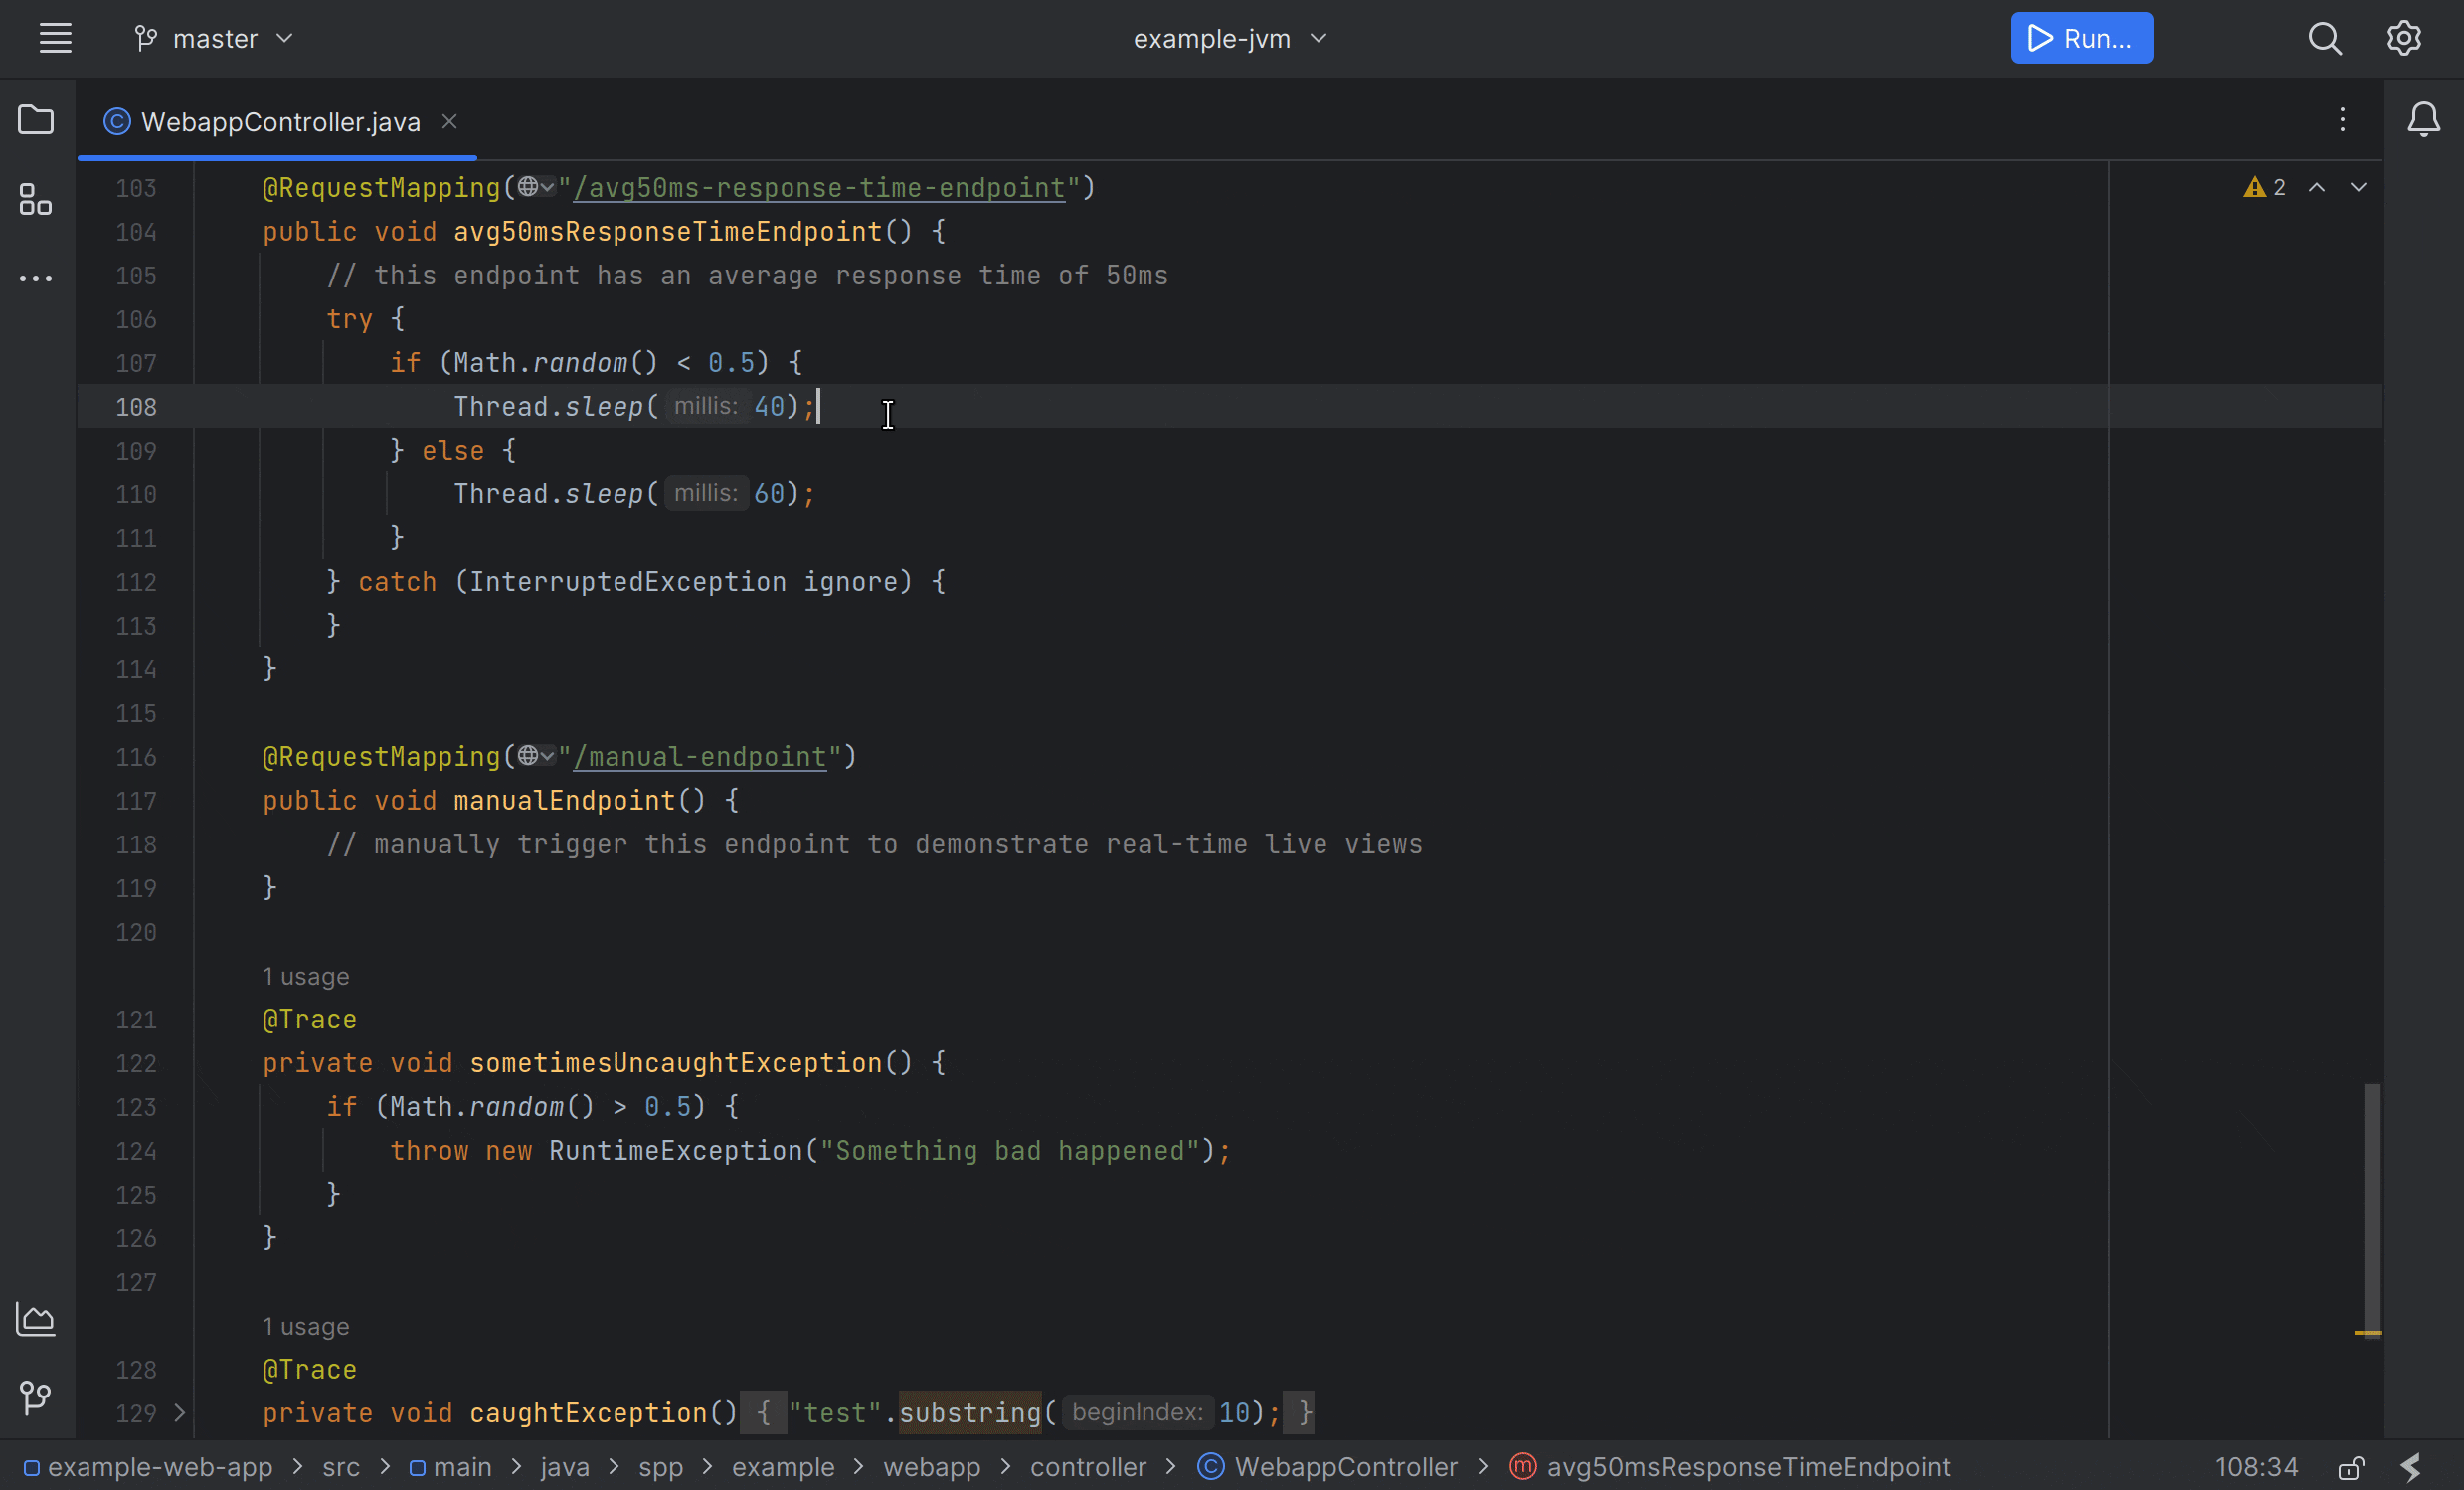
This demonstration shows how to view the activity of an endpoint. The View Activity command is useful for monitoring the throughput, latency, and error rate of a given endpoint.
Command Preview
This demonstration shows how to view the traces of an endpoint. The View Traces command is useful for exploring the execution path of a given endpoint.
Live Indicators allow you to automatically display user-defined metrics in the IDE. These metrics can be used to monitor the health of your application or provide insight into the current state of the application.
This demonstration shows how failing endpoints can be detected and displayed in the IDE. The Failing Endpoint indicator is useful for identifying endpoints that are actively failing and require attention.
This demonstration shows how high load endpoints can be detected and displayed in the IDE. The High Load Endpoint indicator is useful for identifying endpoints that are experiencing high load and may require scaling.
This demonstration shows how slow endpoints can be detected and displayed in the IDE. The Slow Endpoint indicator is useful for identifying endpoints that are experiencing slow response times and may require optimization.
This demonstration shows how unused endpoints can be detected and displayed in the IDE. The Unused Endpoint indicator is useful for identifying endpoints that are not being used and may be able to be removed.
Bug reports and feature requests can be created here.