At the Süddeutsche Zeitung Editor's Lab we were working on a better way to deal with opinion polls.
In autumn 2017 the next general election will be held. In the months to come, opinion polls play an even more important component of reporting about German politics.
Traditionally, media outlets are reporting about in a new poll in the following style: If election would be held today, party x would get y per cent of the votes. This is a decline of z per cent compared to previous week.
This has two major shortcomings.
As it is the case with a lot of data: We readers are tempted to take them as a fact - solely due the fact of decimal places. But in fact, polls have a insecurity attached which has mainly two sources:
-
Most of the times, only the key figure is communicated: the mean value. Statistically, this value is wrapped inside a error range. So a better approach would be to publish the mean along with a confidence level. That can be interpreted as "In 95 percent the party's result will be between 10 and 15 per cent."
-
Every polling institute has its own way of conduction its survey: How big is the sample size? How do they weigh different demographics? How do they treat undecided voters or non-voters? Therefore every survey is wrong in its own way. But on an aggregate level they provide valid information about potential voting patterns of the electorate.
Therefore a smarter way of reporting about opinion polls is to get as many data as possible.
The most comprehensive overview of German opinion polls can be found on Wahlrecht.de, a website about maintained by volunteers.
The data on Wahlrecht.de has information on the party's survey result and the sample size. This offers the opportunity to calculate standard errors (se) and a confidence intervall (ci) from the party result p.
The corresponding formula:
se = sqrt(p * (1-p) / n)
se: standard error p: survey result n: sample size
Assuming the data to follow a normal distribution and using a significance level of 0.05 and a z-value of 1.96 the confidence intervall can be computed:
half size of ci: delta = 1.96 * se = 1.96 * sqrt(p * (1-p) / n) Lower limit: ci_lower = p - delta Upper limit: ci_upper = p + delta
In order to offer a single value we compute an average of the latest polls of every polling institute which is included in our data set (in March 2017, seven institutes in total). Instead of a simple arithmetic mean, we use a weighted average, the weights provided from the sample size of each poll. So with individual survey results p_1 ... p_k and sample sizes n_1 ... n_k, the average would be:
p = (p_1 * n_1 + p_2 * n_2 + ... + p_k * n_k) / (n_1 + n_2 + ... + n_k)
Now we have a indiviual error bar for every survey and a weighted average of all the surveys. That's missing are the error bars for the average. These are calculated with a linear error propagation. We use the linear propagation instead of a squared propagation becauase the assume the different surveys not to be statistical independent. So with individual survey errors delta_1 ... delta_k and sample sizes n_1 ... n_k, the average error size would be:
delta = (delta_1 * n_1 + delta_2 * n_2 + ... + delta_k * n_k) / (n_1 + n_2 + ... + n_k)
And for the total confidence intervall we get
Lower limit: ci_lower = p - delta Upper limit: ci_upper = p + delta
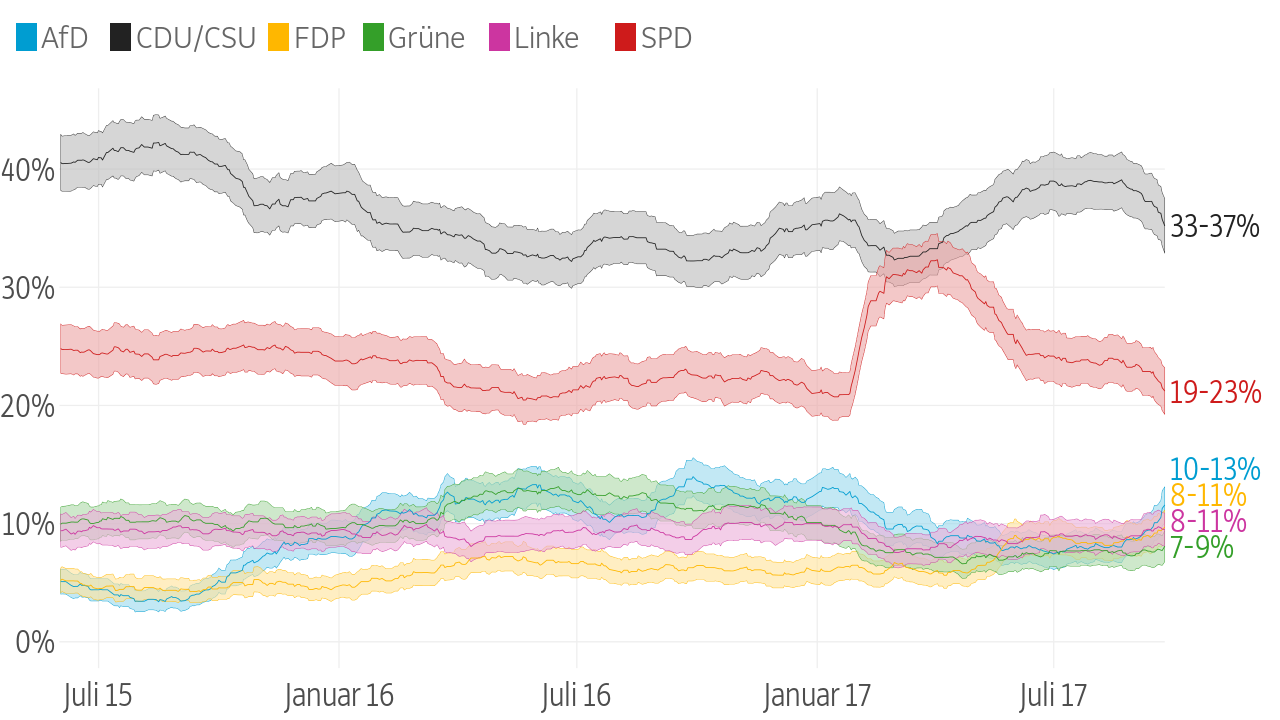
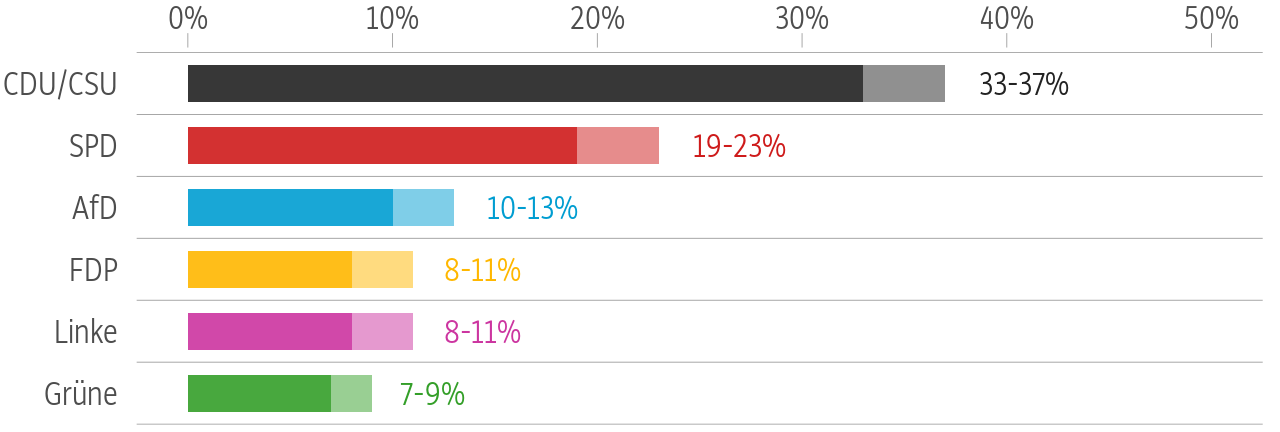
Out of that data, we produce two different graphics. One shows the current political mood, using only the latest poll from every institute. The other one shows the development over a longer time, calculating for every day the average of the latest polls available on that day.
Wen würden Sie wählen, wenn am Sonntag Bundestagswahl wäre?
Umfrageergebnisse liefern keine exakten Werte, sondern geben eine Spanne an, innerhalb der die Ergebnisse für eine Partei wahrscheinlich liegen. Die Institute setzen verschiedene Methoden ein, die zu unterschiedlichen Ergebnissen führen. Die Linie zeigt den gewichteten Mittelwert der jeweils neuesten Umfrage von sieben Instituten.
Wen würden Sie wählen, wenn am Sonntag Bundestagswahl wäre?
Umfrageergebnisse liefern keine exakten Werte, sondern geben eine Spanne an, innerhalb der die Ergebnisse für eine Partei wahrscheinlich liegen. Die Institute setzen verschiedene Methoden ein, die zu unterschiedlichen Ergebnissen führen. Die Balken zeigen den gewichteten Mittelwert der jeweils neuesten Umfrage von sieben Instituten.
Quelle: http://www.wahlrecht.de
Requirements NodeJS 4+, R 3.3+
Installation Ensure you have nodeJs and R installed. Then run Rscript install.R in the project folder to install the requried packages.
This project consists of a set of small scripts that may be used independently of each other. @see tasks directory
To completely build the project run either Rscript main.R or npm start. This will
- scrape the data from the given website and generate a file
data/data-input-longform.csv - perform the statistical transformation and save the result in
data/data-latest-average.csv - create a visualization of the transformed data in
data/assets/plot.svgand - updates the
README.mdwith the latest scraped images and markdown snippets fromdata/*.md
These tasks are also mapped in the package.json and may be started using npm run <task>
To scrape the poll data from www.wahlrecht.de, run Rscript tasks/scrape-wahlrechtde-umfragen.R. This will create
a table at data/data-input-longform.csv.
Rscript tasks/calculations-latest_polls_weights.R transforms table data in data/data-input-longform.csv by our statistical method and stores the following results
data/data-rolling-average-and-error.csvtimebased chart
In order to visualize the data in data/data-rolling-average-and-error.csv, run the scripts
'Rscripts tasks/chart-longterm-polls.R'")' and 'Rscript tasks/chart-sunday-polls.R'.
This will create above images and store them in data/assets/.
- some possible errors may be solved by running the scripts (like main.R) in RStudio, instead of the cli