Inspired by the Ferguson, Missouri (MI) riots of 2014, this project analyzes and discusses the dependence of city and county revenue generated from fines and forfeitures (primarily traffic violations) and their potential effects on the incidence of violent crimes. The analysis is done on an aggregated state level and concerns the calendar year 2013 only. It is based on five data sets, of which three required extensive Extract, Transform, and Load (“ETL”) processes. Although further research is required to more fully explain violent crime, the paper finds a positive linear relationship between fines and violent crimes at the state level. It also offer reasons why this may be true by looking at the rate of searches, stops, and contraband found in seven states.
- Sunlight Foundation - U.S. Census data on tax and fine revenue for over 3,500 reporting jurisdictions- counties and cities
- FBI - Violent crimes reported by city
- Stanford - Traffic stops reported by state
- U.S. Census data for population statistics [source: 2010 U.S. Census]
- Average annual unemployment rates by state for 2013 [source: Bureau of Labor Statistics]
After the shooting of Michael Brown in Ferguson (August 2014), politicians discussed how levels of policing activity made it harder for Law Enforcement to gain the trust of the public. Part of our motivation was to understand why this might true. As part of our Search Rate analysis, we looked at the rate of searches and pullovers for blacks vs. the generation population in seven states, including Missouri. The team found that at least in six other states in 2013, police were not just arresting anyone for petty violations; the black population was being unfairly targeted. A closer look at the design and results of our Search Rate analysis explains this in detail. The literature in this area explain how courts may be imposing excessive fines on lower income residents without regard to their ability to pay.

We tested whether the commonly held belief that high unemployment rates lead to higher crimes held true. Although many academic studies have debunked this myth, we ran a regression for annual average unemployment rates of 48 states against violent crime/capita to confirm the weak relationship.

The second regression for the 48 states ran fines per capita against violent crimes per capita. Unlike the plot above, we were able to fit a line with an Adjusted R2 of 0.21 at a statistically significant level (p = 0.05).
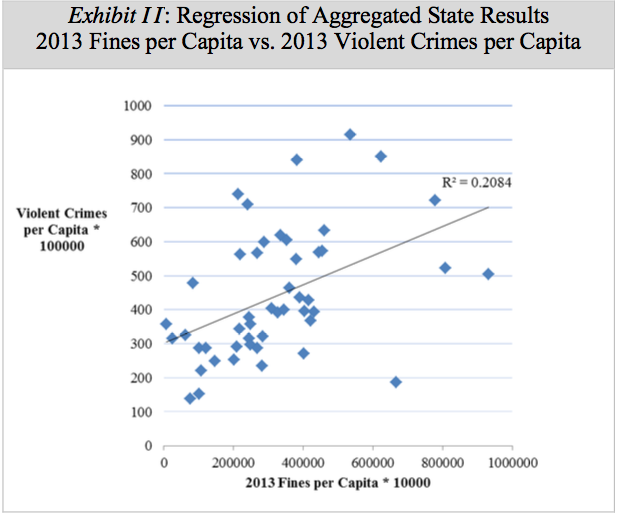
We argue that this trend indicates that the predictor variable, fines per capita, still provides information on violent crimes even though data points fall further from the regression line. In the context of a low Adjusted R2 but statistically significant level, one might choose to increase the explanatory power of the model by adding variables, but this direction was not the point of the team’s analytic. Instead, we analyzed the results of our aggregated data by looking at the top eleven states in our dependent variables (unemployment and fines). The results are presented below:
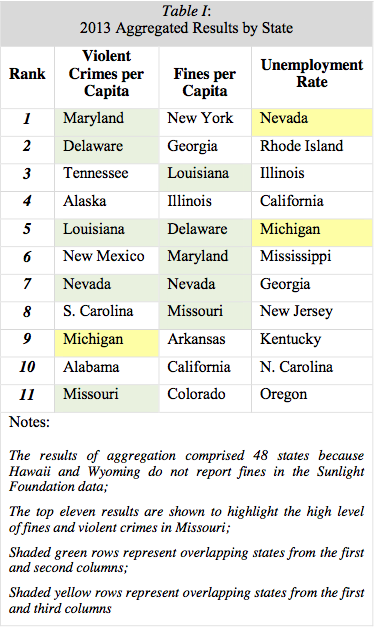
Table I shows that five of the top eleven states with the highest fines per capita also had the highest violent crimes per capita. These states are shaded in green and include Louisiana, Delaware, Maryland, Nevada, and Missouri. When looking at unemployment, only two states— Nevada and Michigan— also fell in the top eleven violent states; they are shaded in yellow. This analysis should be considered in conjunction with the positive trend in the regression because it allows a policy maker to hone in on certain problem areas.
Finally, we used our aggregated state level data to consider the consequences of excessive policing of petty crimes, in general. After all, it is possible that the citizens are simply committing more crimes resulting in more fines. We conducted a Search Rate analysis to see whether the practice makes sense from the standpoint of reducing crime. By combining our statewide data of pullovers with U.S Census population data, we aggregated information on pullovers for the general population vs. black population to analyze the rate at which blacks were being searched, stopped, and whether contraband was found. Due to significant differences in how the two sources defined race and ethnicities, it was not possible to look at other minority populations. The results of seven states are summarized below:
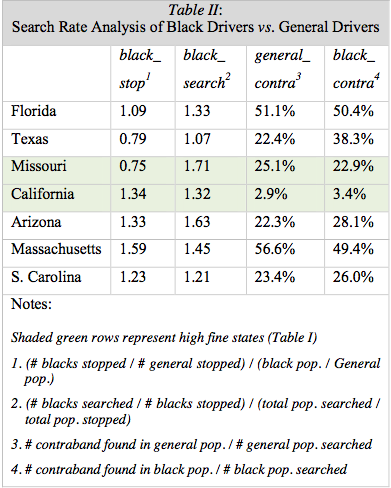
The notes in Table II above explain our methodology of comparing rates of being stopped, searched, and finding contraband on the black driver population vs. general driver population. To interpret the first and second columns, for example, a ratio of 1.00 suggests that blacks are stopped and searched, respectively, at the same rates as the general population. The third and fourth columns are percentages of contraband found in the general population and black population, respectively.
Looking at Missouri, black drivers are 71% more likely to be searched after being stopped compared to the general population. That is despite the fact that searches of black drivers resulted in contraband 23% of the time while general drivers searched by police were found to have contraband 25% of the time (i.e., roughly equal). The effect is even more pronounced for Massachusetts.
Much of the existing literature says that it is not normal for local governments to generate excessive revenue through policing petty crimes. There was little technical discussion, however, on why precisely this is an unhealthy practice.
This paper was aligned with previous studies which debunked the common myth that unemployment and violent crimes are strongly correlated. It then tested whether there was any positive linear relationship between fines and violent crimes. Due to the complex ways in which boundaries are drawn and crimes are defined, we saw no relationship at the local level. At the state level, the linear relationship became apparent and statistically significant. The results of our fit were confirmed by overlaps between the top fine states and top violent crime states. There was also discussion on equitable treatment with stops and searches with respect to certain subsets of the population.
The causes of violent crime are a highly nuanced topic. We showed that a relationship between areas marked by high fines and high rates of violent crime exists, and there are potential consequences of excess fining in certain areas. We have provided a preliminary overview in technical, yet simple terms, on what we know about the relationship between fines and crimes.