Navigation displays in your browser!
Navgauge makes navigation data available via NMEA 0183 and NMEA 2000 (N2K) available on your browser in customizable displays.
On the server side it is a Node.js http server application that pipes data from N2K and NMEA connections to the browser via Websockets.
On the browser it uses Javascript to update SVG gauges as data is received. Position is plotted on a WMS chart.
Access to N2K bus is available via actisense-serial and Actisense NGT-1 N2K USB adapter. N2K messages are parsed to JSON using analyzer available in CANboat.
Navgauge uses gpspipe from gpsd to access NMEA 0183 data. Any NMEA 0183 device available via gpsd can be used and adding support for previously unknown NMEA 0183 sentences is pretty straightforward.
Captured data sets, either directly from actisense-serial and gpspipe or Navgauge-generated unified json stream, can be used to 'play back' real world data to use in debugging and development.
NMEA 0183 data can also be broadcast via UDP to be used in other applications such as iNavX and iRegatta.
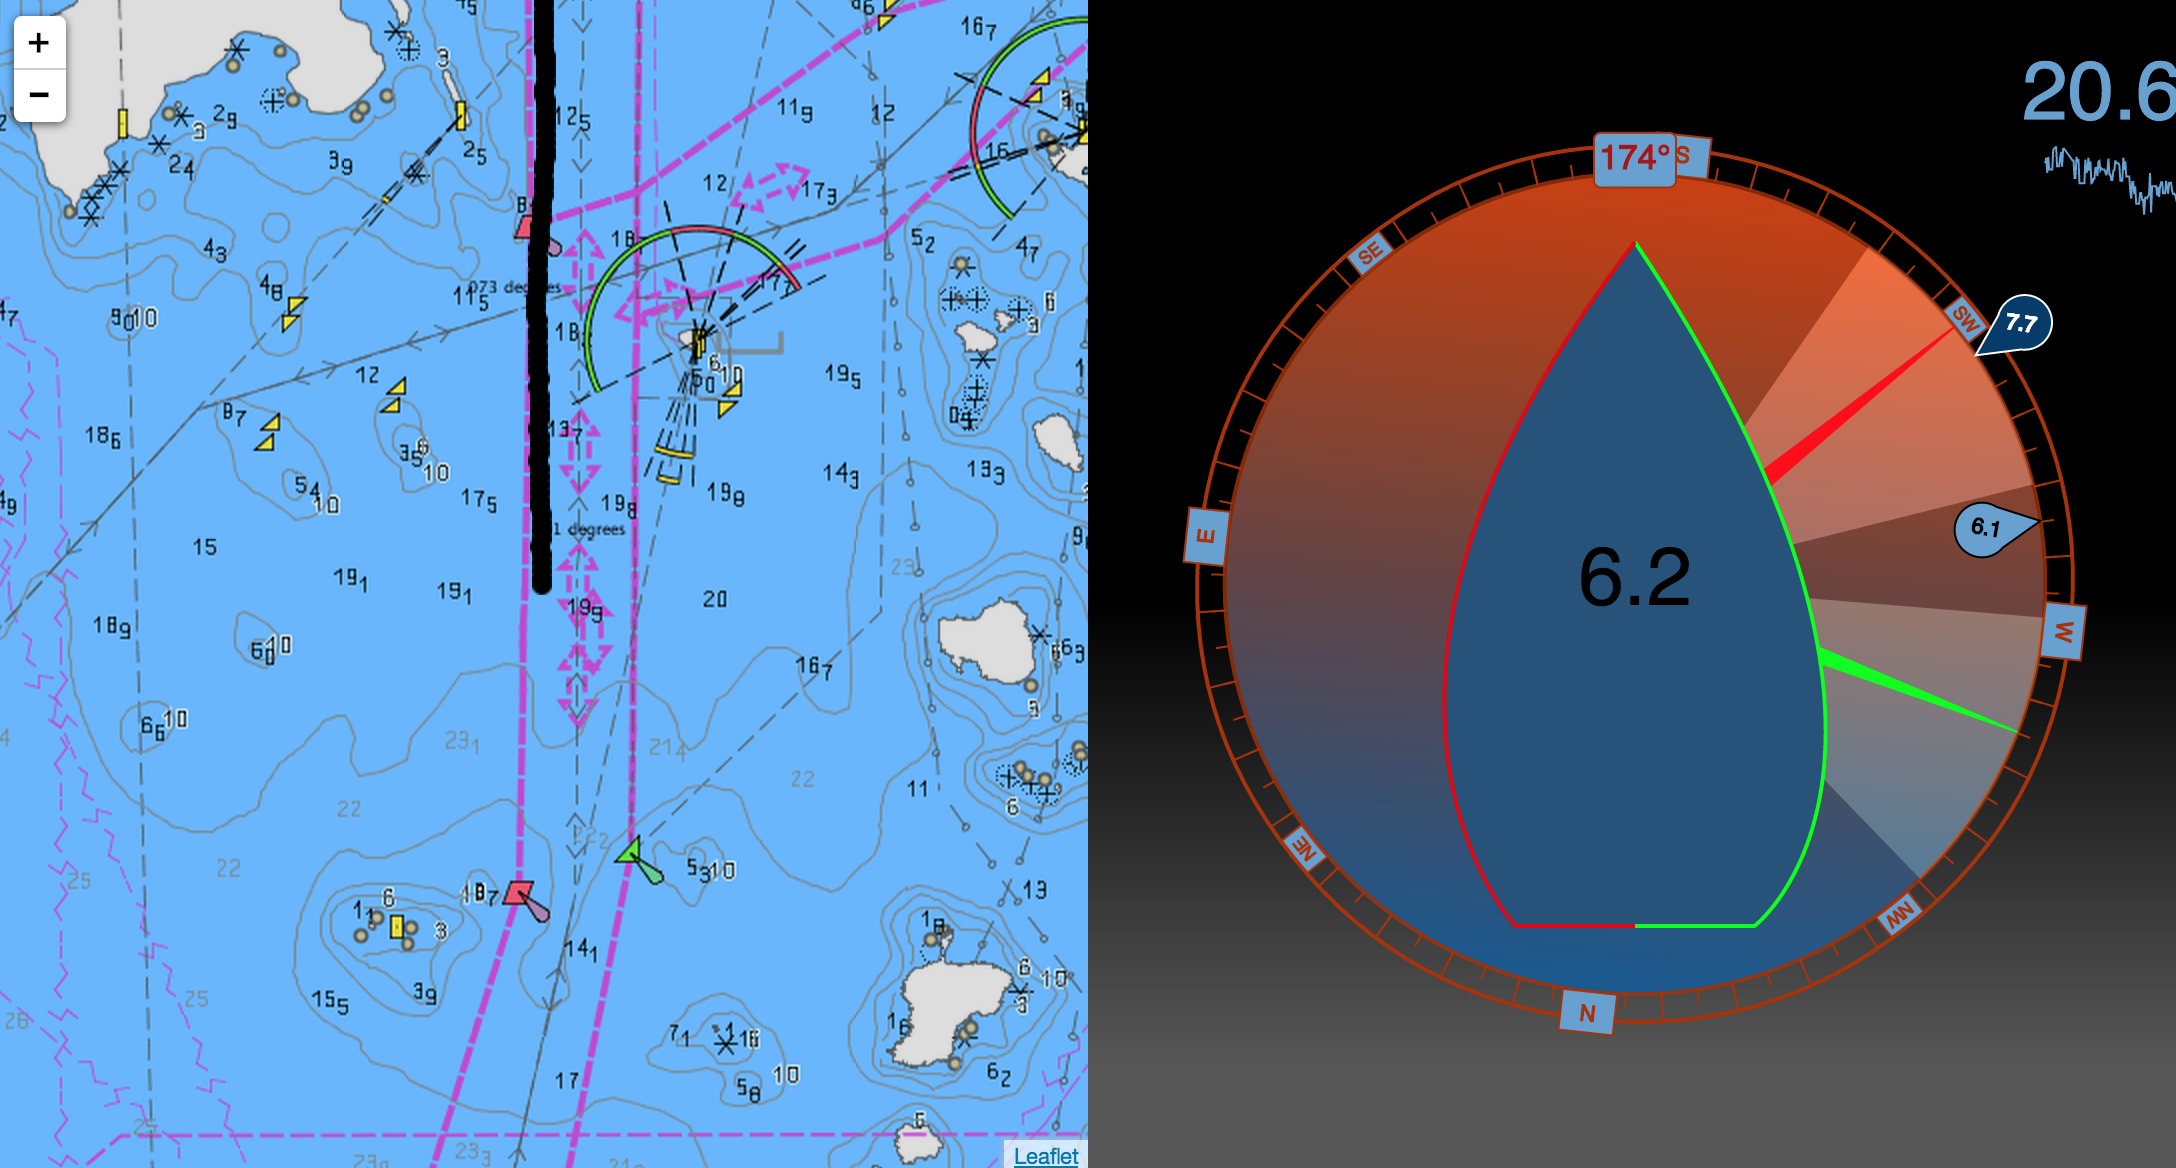
- Multifunction gauge with map: http://navgauge.herokuapp.com
- Swipeable multipage display with multifunction gauge, ground wind history, performance polar history plot, raw bus data and map.
- Gauges: http://navgauge.herokuapp.com/gauges.html
- Install Node.js
- Install Navgauge from tarball:
npm install https://github.com/tkurki/navgauge/tarball/master
- Start the server with a sample data set from the boat Cassiopeia:
node_modules/navgauge/bin/cassiopeia
- Open http://localhost:8080/ to see a navigation display, http://localhost:8080/swipe.html for a multi-page display or http://localhost:8080/gauges.html for some sample gauges.
Navgauge uses shell commands to start CANboat command line tools actisense-serial and analyzer (N2K data) and
gpspipe (NMEA 0183) so those need to be available on your path.
Once you have command line access you can look at the data you have and figure out how basic navigation data such as speed, bearing and wind speed and direction are represented and figure out how to write the stream definition for your boat. See for example [Cassiopeia] (https://github.com/tkurki/navgauge/blob/master/lib/boats/cassiopeia.js).
Navgauge server is started with bin/server.js and takes the following options:
Options:
  --n2k        actisense:/dev/USBxx|file:n2k.data[.gz]
  --nmea       [gpspipe[:port]],[gpspipe:port],[file:nmea.data[.gz]]
               Read with gpspipe -r or from file (optionally gzipped)

  --json       [file:filename.json] Read data from [filename] in
               "raw" object literal json format previously written by
               Naviserver
  -u           Broadcast nmea 0183 via udp on port 7777
  -b           Broadcast address for udp broadcast
  --writejson  Write the internal json stream to [filename]
  -p           http port                               [default: 8080]
  --boat       boat configuration, loaded from boats/ directory
                                                            [required]
Take a look at cassiopeia, plaka and freya under lib/boats/, roll your own and add .log() statements to the
incoming streams in your boat configuration file to see what your data actually looks like.
-
Runs anywhere where you have Node, gpsd and C compiler for CANboat. My primary target is Raspberry Pi with its modest power consumption, but I've run Navgauge on OS X as well.
-
DIY: General purpose language and short write-to-test cycle. Javascript is easy to understand & write, with all its shortcomings, and there is a wealth of tutorials and whatnot for HTML5 development. Edit & restart or reload is all that is needed to see how your changes work. UI tweaking can be done directly in the browser. Bacon Js makes combining and routing messages easily approachable. JSON is human readable and understandable.
-
No need for desktop computer or a dedicated display. Everybody has a phone or a tablet.
-
B&G SailSteer looked like something I'd like, but I don't want to upgrade my plotter (read: costs too much..).
-
I was disappointed with the gauge displays available on my Raymarine i70. You have the data, do what you want as opposed to being limited by the built-in display formats and functions in MFDs. Want a sparkline for certain datum? Change the color scheme? Make depth figure big & red if it is less than 6 meters? A simple list of all the data available on the bus? A colored polar plot of ground wind history with smoothly fading trail?? Just do it...
- more sample boats: if you have data captures from your boat please file an issue and I'll see what I can do, I'd like to get more insight into navigation data
- translate select N2K messages to NMEA 0183 for iRegatta et al (my case: wind info)
- course projection and layline visualization on the map
- transform data from one message type to another and push to the N2K bus, for example adjust depth below transducer to depth below keel and send it back to the bus so that all N2k displays can use the same adjusted data
-
not use gpsd json? I wanted to have access to both raw & parsed nmea data. Adding another input stream for reading gpsd json might be a good idea.
-
not use OpenCPN? Because it is not browser based and as I understand it doesn't support N2K.
-
not use Freeboard? Because it uses a serverside framework, I don't want the extra hassle of Arduino and it looks a bit complicated to get up and running.
This is a learning experience in many respects. If you see something that could be improved let me know. If you see something you think you could fix please do & send a pull request!
There is an ongoing discussion & preliminary specification for a generic, open REST api and data model for navigation-related data at