
This project is inspired by THIS PROJECT which reads CPU usage and turns on several LEDs. My implementation rather uses 8x8 matrix display where I wanted to show CPU usage as a history graph. From mentioned project I used 'get_cpu_usage' which reads Linux' /proc/stat file and wrote my logic to draw CPU history graph.
- It's written in C++.
- It uses popular WiringPi lib to control GPIOs.
- It uses Max7219 library I created based on THIS CODE to easy communicate with 8x8 display using any 3 digital pins. HERE you can find additinal information about commands that MAX7219 can receive so you can customize it as you like. MAX7219 is a chip that drives 8x8 display.
- Install WiringPi: http://wiringpi.com/download-and-install/
- Clone this project
- Run 'make' to build executable
- Execute with 'sudo ./cpugraphpi 1000' (1000 means 1000ms delay after each reading)
The code is set to use these pins but you are free to change them:
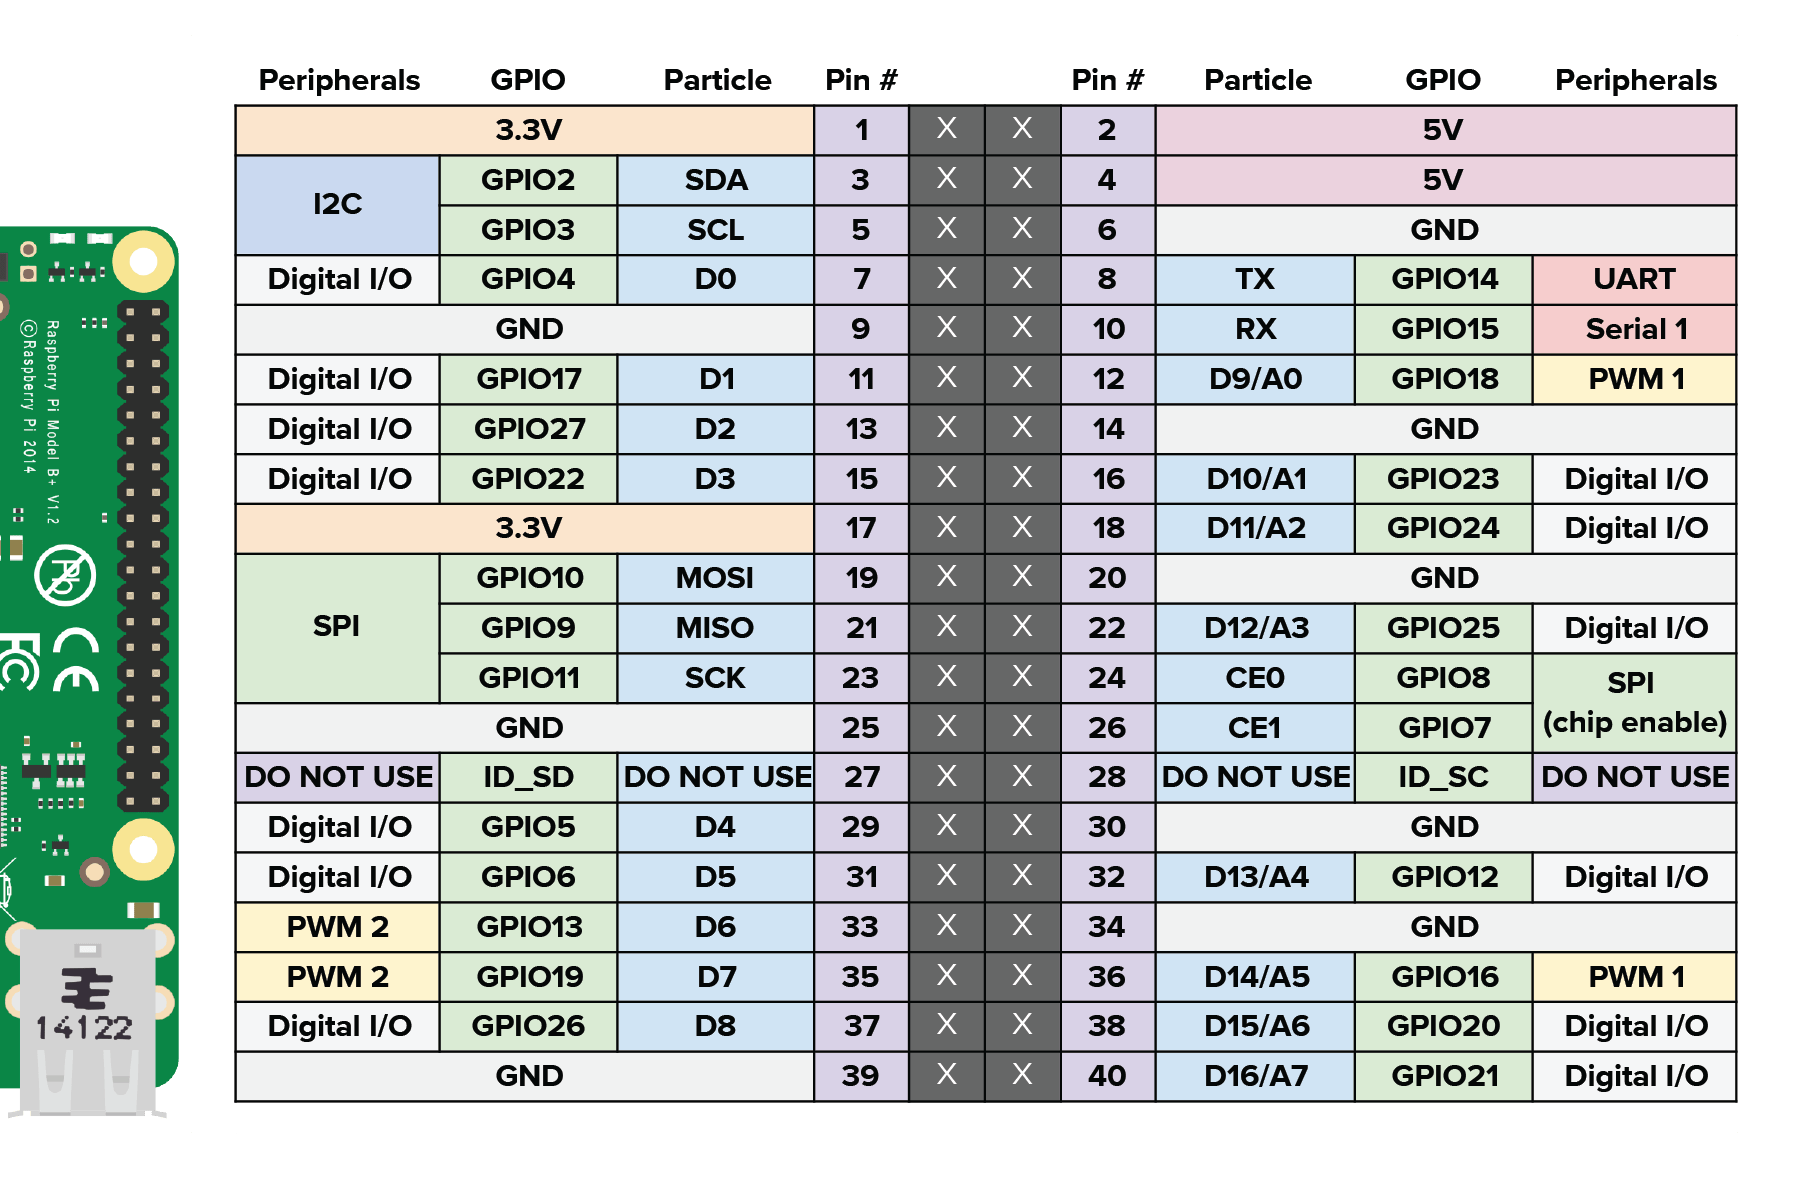
+5V/VCC:     Rpi header pin 2
GND:         Rpi header pin 6

DATA/DIN:    0 - GPIO 17 (WiringPi pin num 0) Rpi header pin 11
CLOCK/CLK:   3 - GPIO 22 (WiringPi pin num 3) Rpi header pin 15
LOAD/CS:     4 - GPIO 23 (WiringPi pin num 4) Rpi header pin 16