Home
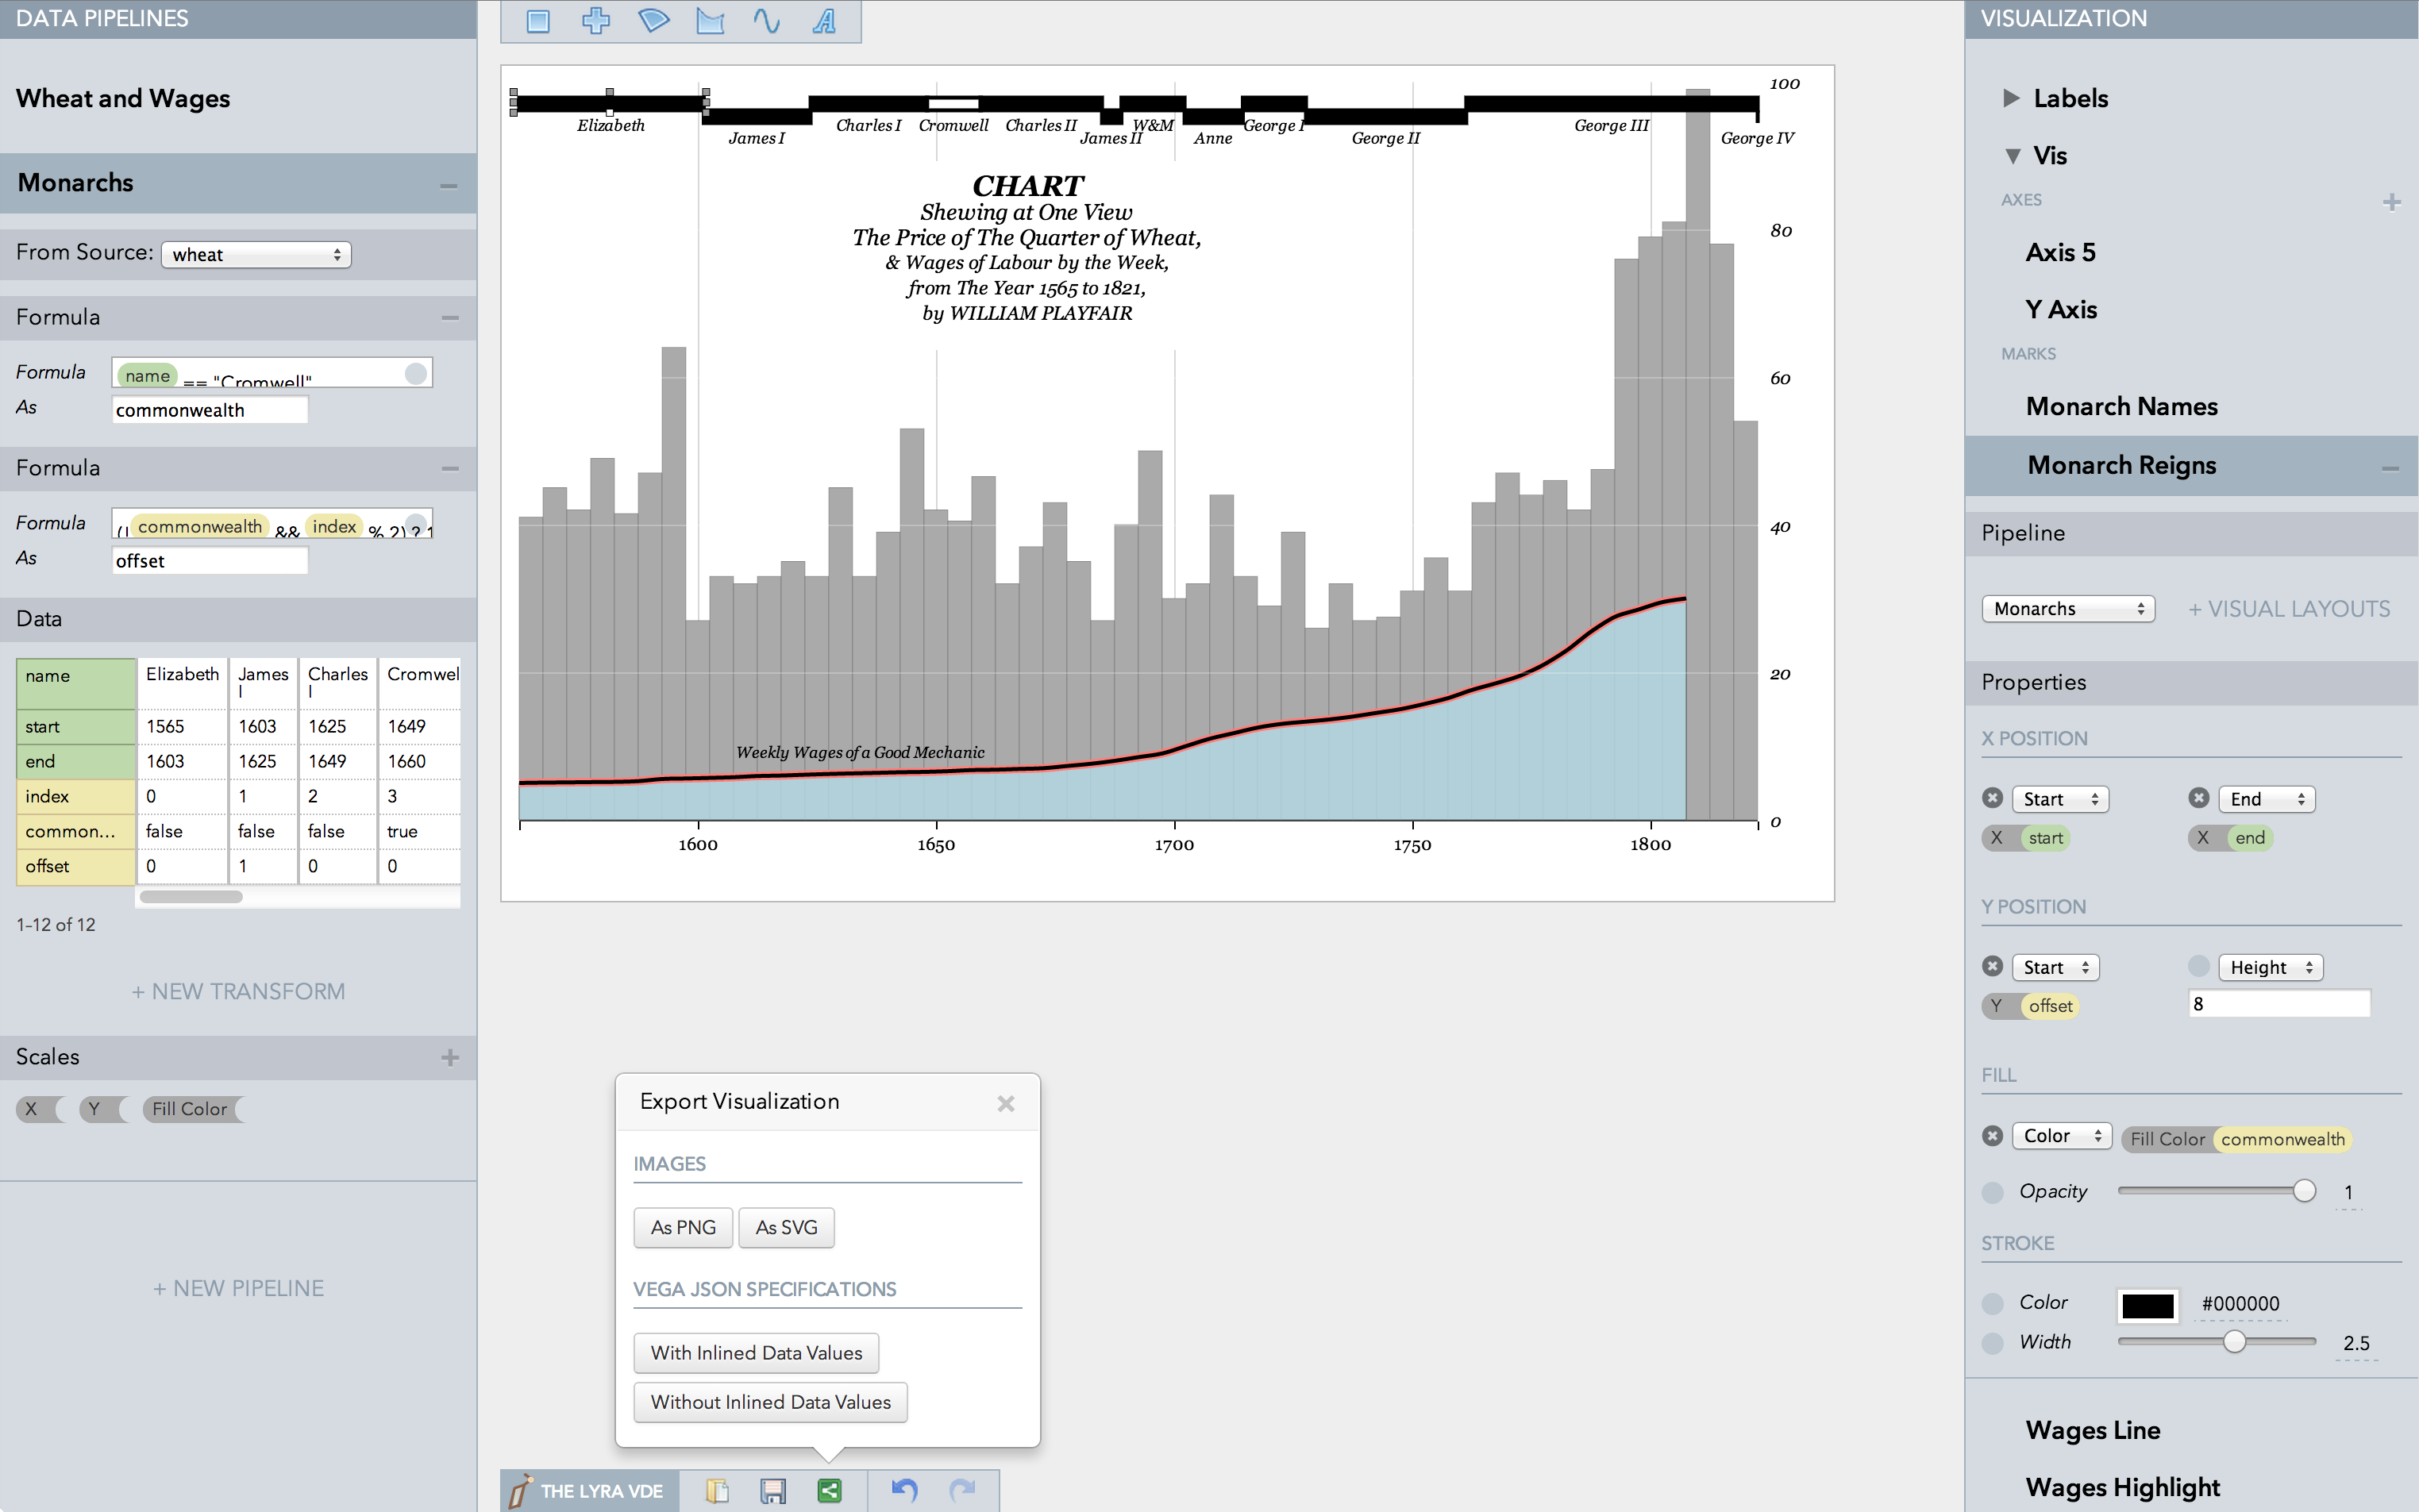
Lyra is an interactive environment that enables custom visualization design without writing any code. Graphical “marks” can be bound to data fields using property drop zones; dynamically positioned using connectors; and directly moved, rotated, and resized using handles. Lyra also provides a data pipeline interface for iterative visual specification of data transformations and layout algorithms. Lyra is more expressive than interactive systems like Tableau, allowing designers to create custom visualizations comparable to hand-coded visualizations built with D3 or Processing. These visualizations can then be easily published and reused on the Web.
- Let's Make a Bar Chart by Jim Vallandingham
- The New York Times' Driving Shifts into Reverse by Kevin Liang
Lyra is currently alpha software, so beware of bugs! If you experience a bug, please file a bug report. We would also love to hear how to improve Lyra, and see how it is used. Send us any feedback, including links or screenshots of visualizations built with Lyra!