CLI PHP for visualize Machine learning datasets in Graph bar format. Detect Outliers. See your data before Training
Before training processes at Deep Learning, the most hard work is to have a good datasets in its structure. Always we need to check the datasets before and if we see the data in graphs bars is more easy to detect outliers. This php class helps you to detect it with a shortest time. The class alert you about outliers with Red Bars.
You can use it to display standard bar graphs too.
The bar graphs are customizable in:
- Colors
- Background guidelines
- Padding
- Titles
- Height
- Show/Hide data information
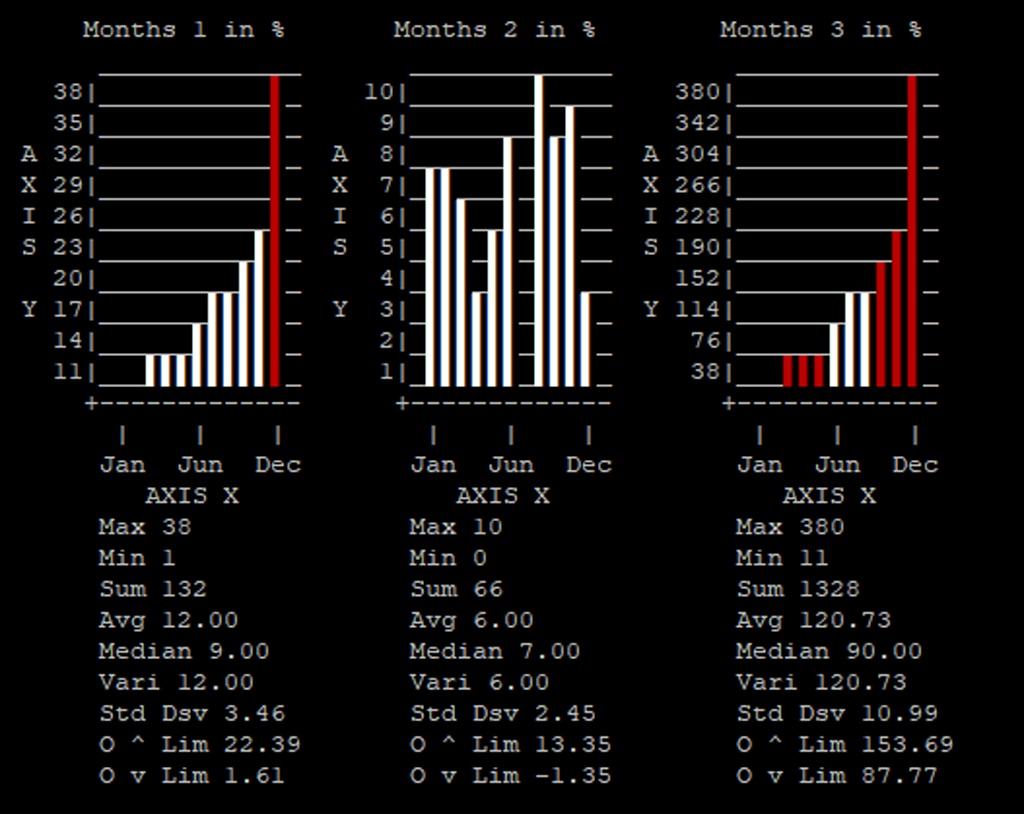 Screenshot of 3 float bar charts in CLI PHP environtment
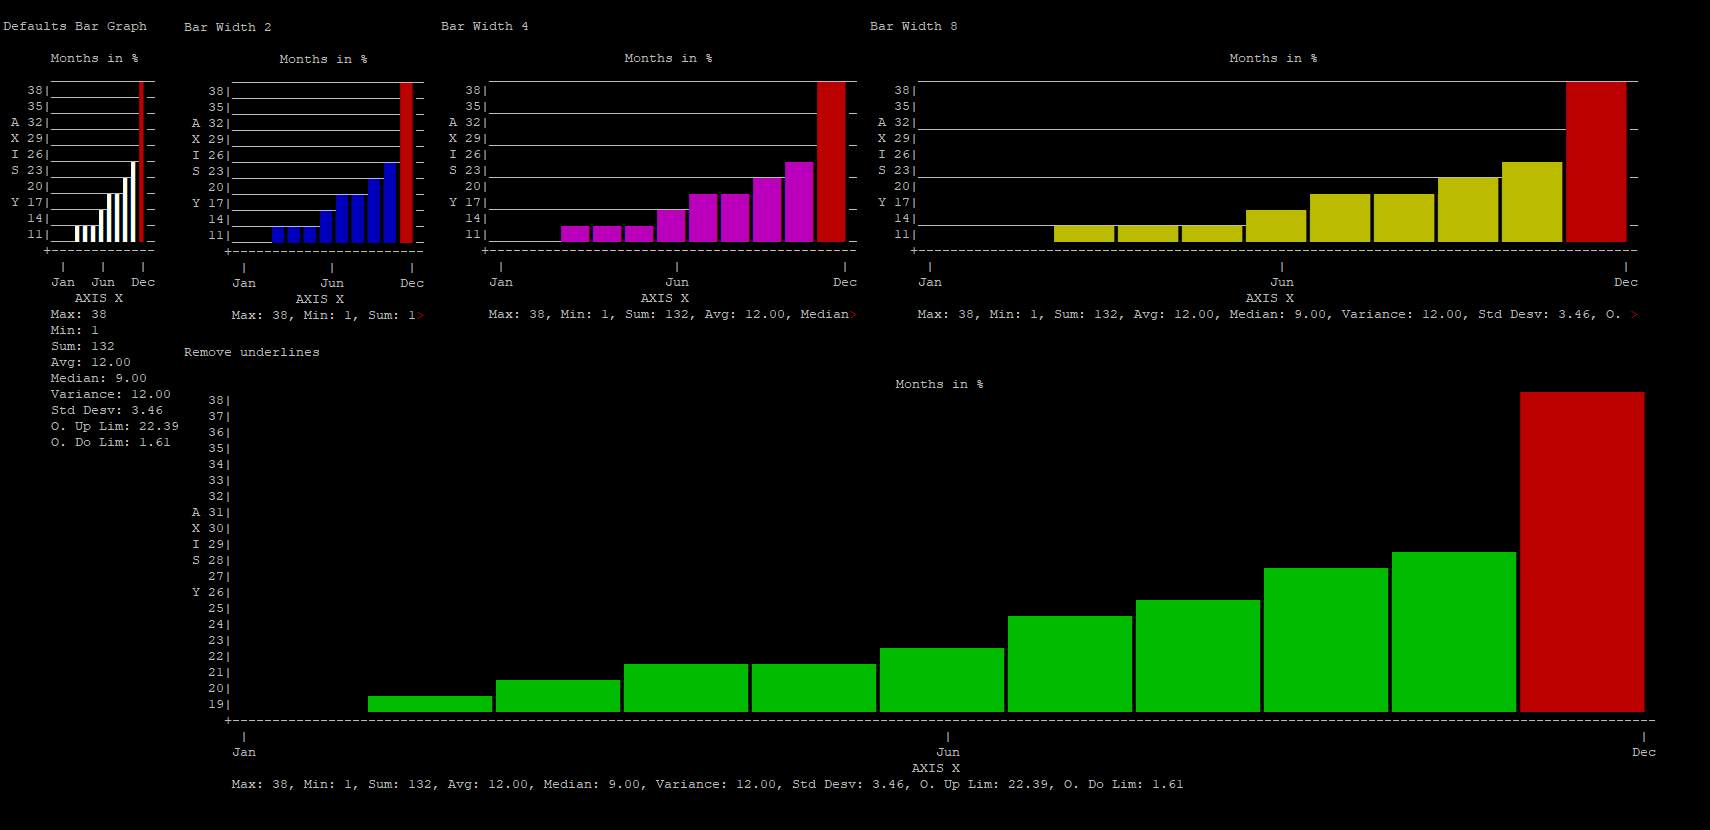 Screenshot of custom bar charts in CLI PHP environtment
-
A minimum (minimum, minimum, minimum requeriments is needed). Tested on:
-
Simple Raspberry pi (B + 512MB 700 MHz ARM11) with Raspbian Lite PHP7.3 (i love this gadgets) 😍
-
VirtualBox Ubuntu Server 20.04.2 LTS (Focal Fossa) with PHP7.4.3
-
Ubuntu 20.04.3 LTS (Focal Fossa). Laptop Acer Extensa 5630 with PHP 7.4.3 (cli) (built: Aug 13 2021 05:39:12) ( NTS )
-
Windows 10 21H1 with PHP 7.4. By https://github.com/bozhinov
-
There are 2 basic files:
cli-graph-ml.class.php -> Master class. This file is the main file that you need to include in your code.
example.php -> example file
You can use the class to display bar charts with all features of colors, formats, ... as standard bar chart. To do it you simply need to hide the data explain the values. Outliers bars will not be drawed in red and will be a standard bar col too. See $bar_graph->set_explain_values( $boolean ); method.
The class has a variable with the outlier_factor. There is no trivial solution for x, but usually, a value between 2 and 4 seems practical. See set_outlier_factor() Method
A lot of easy 😃. It is written in PURE PHP. Only need to include the files. Tested on basic PHP installation
require_once( 'cli-graph-ml.class.php' );
The system will inform to you about:
- Max Value
- Min Value
- Sum of all Values
- Average of values
- Median of values
- Variance of values
- Standard Derivation of values
- Limit Outliers Upper
- Limit Outliers Down
- The outliers values will be drawed in RED column bar (See screenshots)
     $arr_val_example_1 = [  1,2,5,6,7,9,12,15,18,19,38 ];
     $axis_x_values = [ 'Jan', 'Jun', 'Dec' ];

     $bar_graph = new cli_graph_ml( $arr_val_example_1, $axis_x_values );
     $bar_graph->set_title( 'Months in %' );

     // Draw with defaults
     $bar_graph->draw();
- CREATE CLI-GRAPH-ML:
$bar_graph= new cli_graph_ml( $arr_val_example_1, $axis_x_values );
Example:
     $arr_val_example_1 = [  1,2,5,6,7,9,12,15,18,19,38 ];
     $axis_x_values = [ 'Jan', 'Jun', 'Dec' ];

     $bar_graph = new cli_graph_ml( $arr_val_example_1, $axis_x_values );
- SET DE WIDTH OF BARS:
You can set the width of the columns that will drawed. More strong or less. By default is 1 char.
set_bar_width( $num_chars )
Example:
$bar_graph->set_bar_width( 2 );
- SET OUTLIER FACTOR:
Outlier factor determines where a value is inside or outside a noramlly range values. There is no trivial solution for the value, but usually, a value between 2 and 4 seems practical. You can change the outlier factor value with
set_outlier_factor( $float_factor )
Example:
$bar_graph->set_outlier_factor( 3 );
- SET THE COLOR OF THE BARS:
One of this colors: lightblue, 'lightred', 'lightgreen', 'lightyellow, 'lightblack', 'lightmagenta', 'lightcyan', 'lightwhite', 'blue', 'red', 'green', 'yellow', 'black', 'magenta', 'cyan', 'white', 'orange' // if supported by the terminal, 'reset'
set_bar_color( $str_color_name )
Example:
$bar_graph->set_bar_color( 'blue' );
-
SET THE EXPLAINED VALUES IN ONE LINE:
If the graphs are short, then is better do each value one under the other, but if you have a long graph, you can draw it in one line.
set_explain_values_same_line( $boolean )
Example:
$bar_graph->set_explain_values_same_line( true );
- SET THE FREQUENCY OF THE UNDERLINES:
By default, the underlines guides are drawed each line, but you can draw with a step
set_underlines_every( $num_freq );
Example:
$bar_graph->set_underlines_every( 2 ); // Each 2 lines
- SHOW OR HIDE THE VALUES EXPLAINED:
If you do not want to see the values under the graph, you can hide it. If you hide the values, outliers bars will not be drawed in red.
$bar_graph->set_explain_values( $boolean );
Example:
$bar_graph->set_explain_values( false ); // No show explain values
- SHOW 0 VALUES:
If you need to teach a value 0 to be visible, you can create an array of column id's where to show the value even if it is 0 to be able to visualize it. In this case, if the field should be visible, half a gray box will be shown, indicating that the value is 0, but that there is
set_arr_id_data_visible( $arr_id_data_visible )
Example:
// Show 0 values con cols id[0] & id[3]
$arr_id_data_visible = [0, 3];
    $bar_graph->set_arr_id_data_visible($arr_id_data_visible);
- INCREMENT THE SIZE OF THE VERTICAL CHART:
By default, you will see 10 lines of chart. If you want more or less, you can configure it.
set_graph_length( $in_lines )
Example:
$bar_graph->set_graph_length( 20 ); // 20 lines
- DRAW:
You can send the result to the screen with this method
draw( )
Example:
$bar_graph->draw();
You can draw 1 line of the chart. Is used to concatenate more than 1 chart. See example.php. Then you can set some params more to do it. See example.php for more information and example:
- $line_id; // Id of the line to be drawed.
- $do_line_break = false; // Becouse the PHP_EOL will be done at last chart
- $prepare_array_output = false; // becouse we prepare it previously
Example:
    $bar_graph1->prepare_array_output( );
    $bar_graph2->prepare_array_output( );
    $bar_graph3->prepare_array_output( );

    // Draw Line 0 of each graph
    $bar_graph1->draw( 0, false, false);
    $bar_graph2->draw( 0, false, false);
    $bar_graph3->draw( 0, false, false);

    echo PHP_EOL; // after 3rth graph

    // Draw Line 1 of each graph
    $bar_graph1->draw( 1, false, false);
    $bar_graph2->draw( 1, false, false);
    $bar_graph3->draw( 1, false, false);

    echo PHP_EOL; // after 3rth graph


    // Draw Line 2 of each graph
    $bar_graph1->draw( 2, false, false);
    $bar_graph2->draw( 2, false, false);
    $bar_graph3->draw( 2, false, false);

    echo PHP_EOL; // after 3rth graph
    ......
- SET DATA:
When you create the class, it will be created with $data param, but you can change the data when you want.
set_data( $arr_data )
Example:
    $arr_val_example_3 = [  11,22,55,60,70,90,120,150,180,190,380 ];
    $bar_graph->set_data( $arr_val_example_3 );
- SET TITLE:
You can give a Title for be showed as header up your graph.
set_title( $str_title )
Example:
$bar_graph->set_title( 'Months 3 in %' );
- SET AXIS X TITLE:
You can give a Title for be showed under Axis X.
set_x_axis_title( $str_title )
Example:
$bar_graph->set_x_axis_title( 'Axis X Title' );
- SET AXIS Y TITLE:
You can give a Title for be showed under Axis Y.
set_y_axis_title( $str_title )
Example:
$bar_graph->set_y_axis_title( 'Axis X Title' );
- Hide/Show Axis X Title:
You can to show or hide the Axis X Title
set_show_x_axis_title( $boolean )
Example:
$bar_graph->set_show_x_axis_title( false ); // Hide the Axis X title
- Hide/Show Axis Y Title:
You can to show or hide the Axis Y Title
set_show_y_axis_title( $boolean )
Example:
$bar_graph->set_show_y_axis_title( false ); // Hide the Axis Y title
- Hide/Show Axis X & Y Title:
You can to show or hide the Axis X & Y Titles at the same time
set_show_axis_titles( $boolean )
Example:
$bar_graph->set_show_axis_titles( false ); // Hide the Axis X,Y title
- SET AROUND PADDING:
You can set a num of chars of padding each Top, Bottom, Left & Right
set_padding( $num_chars_pad );
Example:
$bar_graph->set_padding( 2 ); // 2 chars for LEFT, RIGHT, TOP & BOTTOM
- SET LEFT PADDING:
You can set a num of chars of left padding
set_left_padding( $num_chars_pad );
Example:
$bar_graph->set_left_padding( 2 ); // 2 chars for LEFT
- SET RIGHT PADDING:
You can set a num of chars of right padding
set_right_padding( $num_chars_pad );
Example:
$bar_graph->set_right_padding( 2 ); // 2 chars for RIGHT
- SET TOP PADDING:
You can set a num of chars of top padding
set_top_padding( $num_chars_pad );
Example:
$bar_graph->set_top_padding( 2 ); // 2 chars for TOP
- SET BOTTOM PADDING:
You can set a num of chars of bottom padding
set_bottom_padding( $num_chars_pad );
Example:
$bar_graph->set_bottom_padding( 2 ); // 2 chars for BOTTOM
- SHOW/HIDE UNDERLINES:
You can show or hide the underlines guides
set_draw_underlines( $boolean );
Example:
$bar_graph->set_draw_underlines( false ); //Hide underlines guides
- SET AXIS X VALUES:
You can set the values for show under the graph at Axis X
set_axis_x_values( $arr_values );
Example:
     $axis_x_values = [ 'Jan', 'Jun', 'Dec' ];
     $bar_graph->set_axis_x_values( $axis_x_values );
- CHANGE CONFIGURATION:
You can change the bar graph when you want
set_config( $arr_values );
Example:
     $config = [
            'graph_length'  => 10,
            'bar_color'  => 'lightwhite'
            ];

     $bar_graph->set_config( $config );
- BEFORE DRAW, THE SYSTEM NEED TO PREPARE THE OUTPUT. WITH DRAW() IS CALLED AUTOMATICALLY, BUT YOU CAN TO PREPARE OUTSIDE. SEE EXAMPLE.PHP:
prepare_array_output( )
Example:
$bar_graph->prepare_array_output( );
- GET THE NUMBER OF LINES BEFORE THE OUTPUT:
With next methods you will need to know the numer of lines before de output.
count_output_lines( )
Example:
$count_output_lines = $bar_graph->count_output_lines();
-
DRAW 3 GRAPHS, SIDE BY SIDE (SEE EXAMPLE.PHP):
  // draw 3 graphs floating
  $arr_val_example_1 = [  1,2,5,6,7,9,12,15,18,19,38 ];
  $arr_val_example_2 = [  7,7,6,3,5,8,0,10,8,9,3 ];
  $arr_val_example_3 = [  11,22,55,60,70,90,120,150,180,190,380 ];
  $axis_x_values = [ 'Jan', 'Jun', 'Dec' ];

  $bar_graph = [];

  $bar_graph[] = new cli_graph_ml( $arr_val_example_1, $axis_x_values, $config );
  $bar_graph[0]->set_title( 'Months 1 in %' );

  $bar_graph[] = new cli_graph_ml( $arr_val_example_2, $axis_x_values, $config );
  $bar_graph[1]->set_title( 'Months 2 in %' );

  $bar_graph[] = new cli_graph_ml( $arr_val_example_3, $axis_x_values, $config );
  $bar_graph[2]->set_title( 'Months 3 in %' );

  // Prepare on each graph
  foreach( $bar_graph as$graph){
      $graph->prepare_array_output( );
  }

  // draw on each graph each line
  // IMPORTANT: All graphs will need to have the same number of Lines
  // We take a counter of lines of the first graph. We assume all have the same
  $count_output_lines = $bar_graph[0]->count_output_lines();

  for( $i = 0; $i< $count_output_lines; $i++ ){
     foreach( $bar_graph as $graph){
         $graph->draw( $i, false, false); // Draw line $i, dont do line break and do not do prepare
    }

      echo PHP_EOL; // for get new line
  }
V.1.0.3 Apply some minor changes to clean code. By https://github.com/bozhinov
Of course. You can use it freely 🖖👽
By Rafa.
@author Rafael Martin Soto
@author {@link http://www.inatica.com/ Inatica}
@blog {@link https://rafamartin10.blogspot.com/ Rafael Martin's Blog}
@since SEPTEMBER 2021
@version 1.0.3
@license GNU General Public License v3.0