Skip to content
This repository has been archived by the owner on Mar 11, 2022. It is now read-only.

wi1dcard/redis-exporter-dashboard

Folders and files

NameName
Last commit message
Last commit date

Latest commit


History

2 Commits


Repository files navigation

Enhanced Redis Exporter Dashboard for Kubernetes

This dashboard is forked from oliver006/redis_exporter, aims to better experience while working with Kubernetes and Prometheus Operator.

Notable Changes

  • Allow switching datasources using the $datasource variable.
  • Add variable $service to make the monitoring target human readable, instead of all cluster service IPs listed in $instance.
  • Replace label_values() with query_result(count_over_time(redis_up[$__range])) for variable queries, which retrieves available options within the selected time range instead of latest.
  • Some little layout changes.

Preview

Downloads

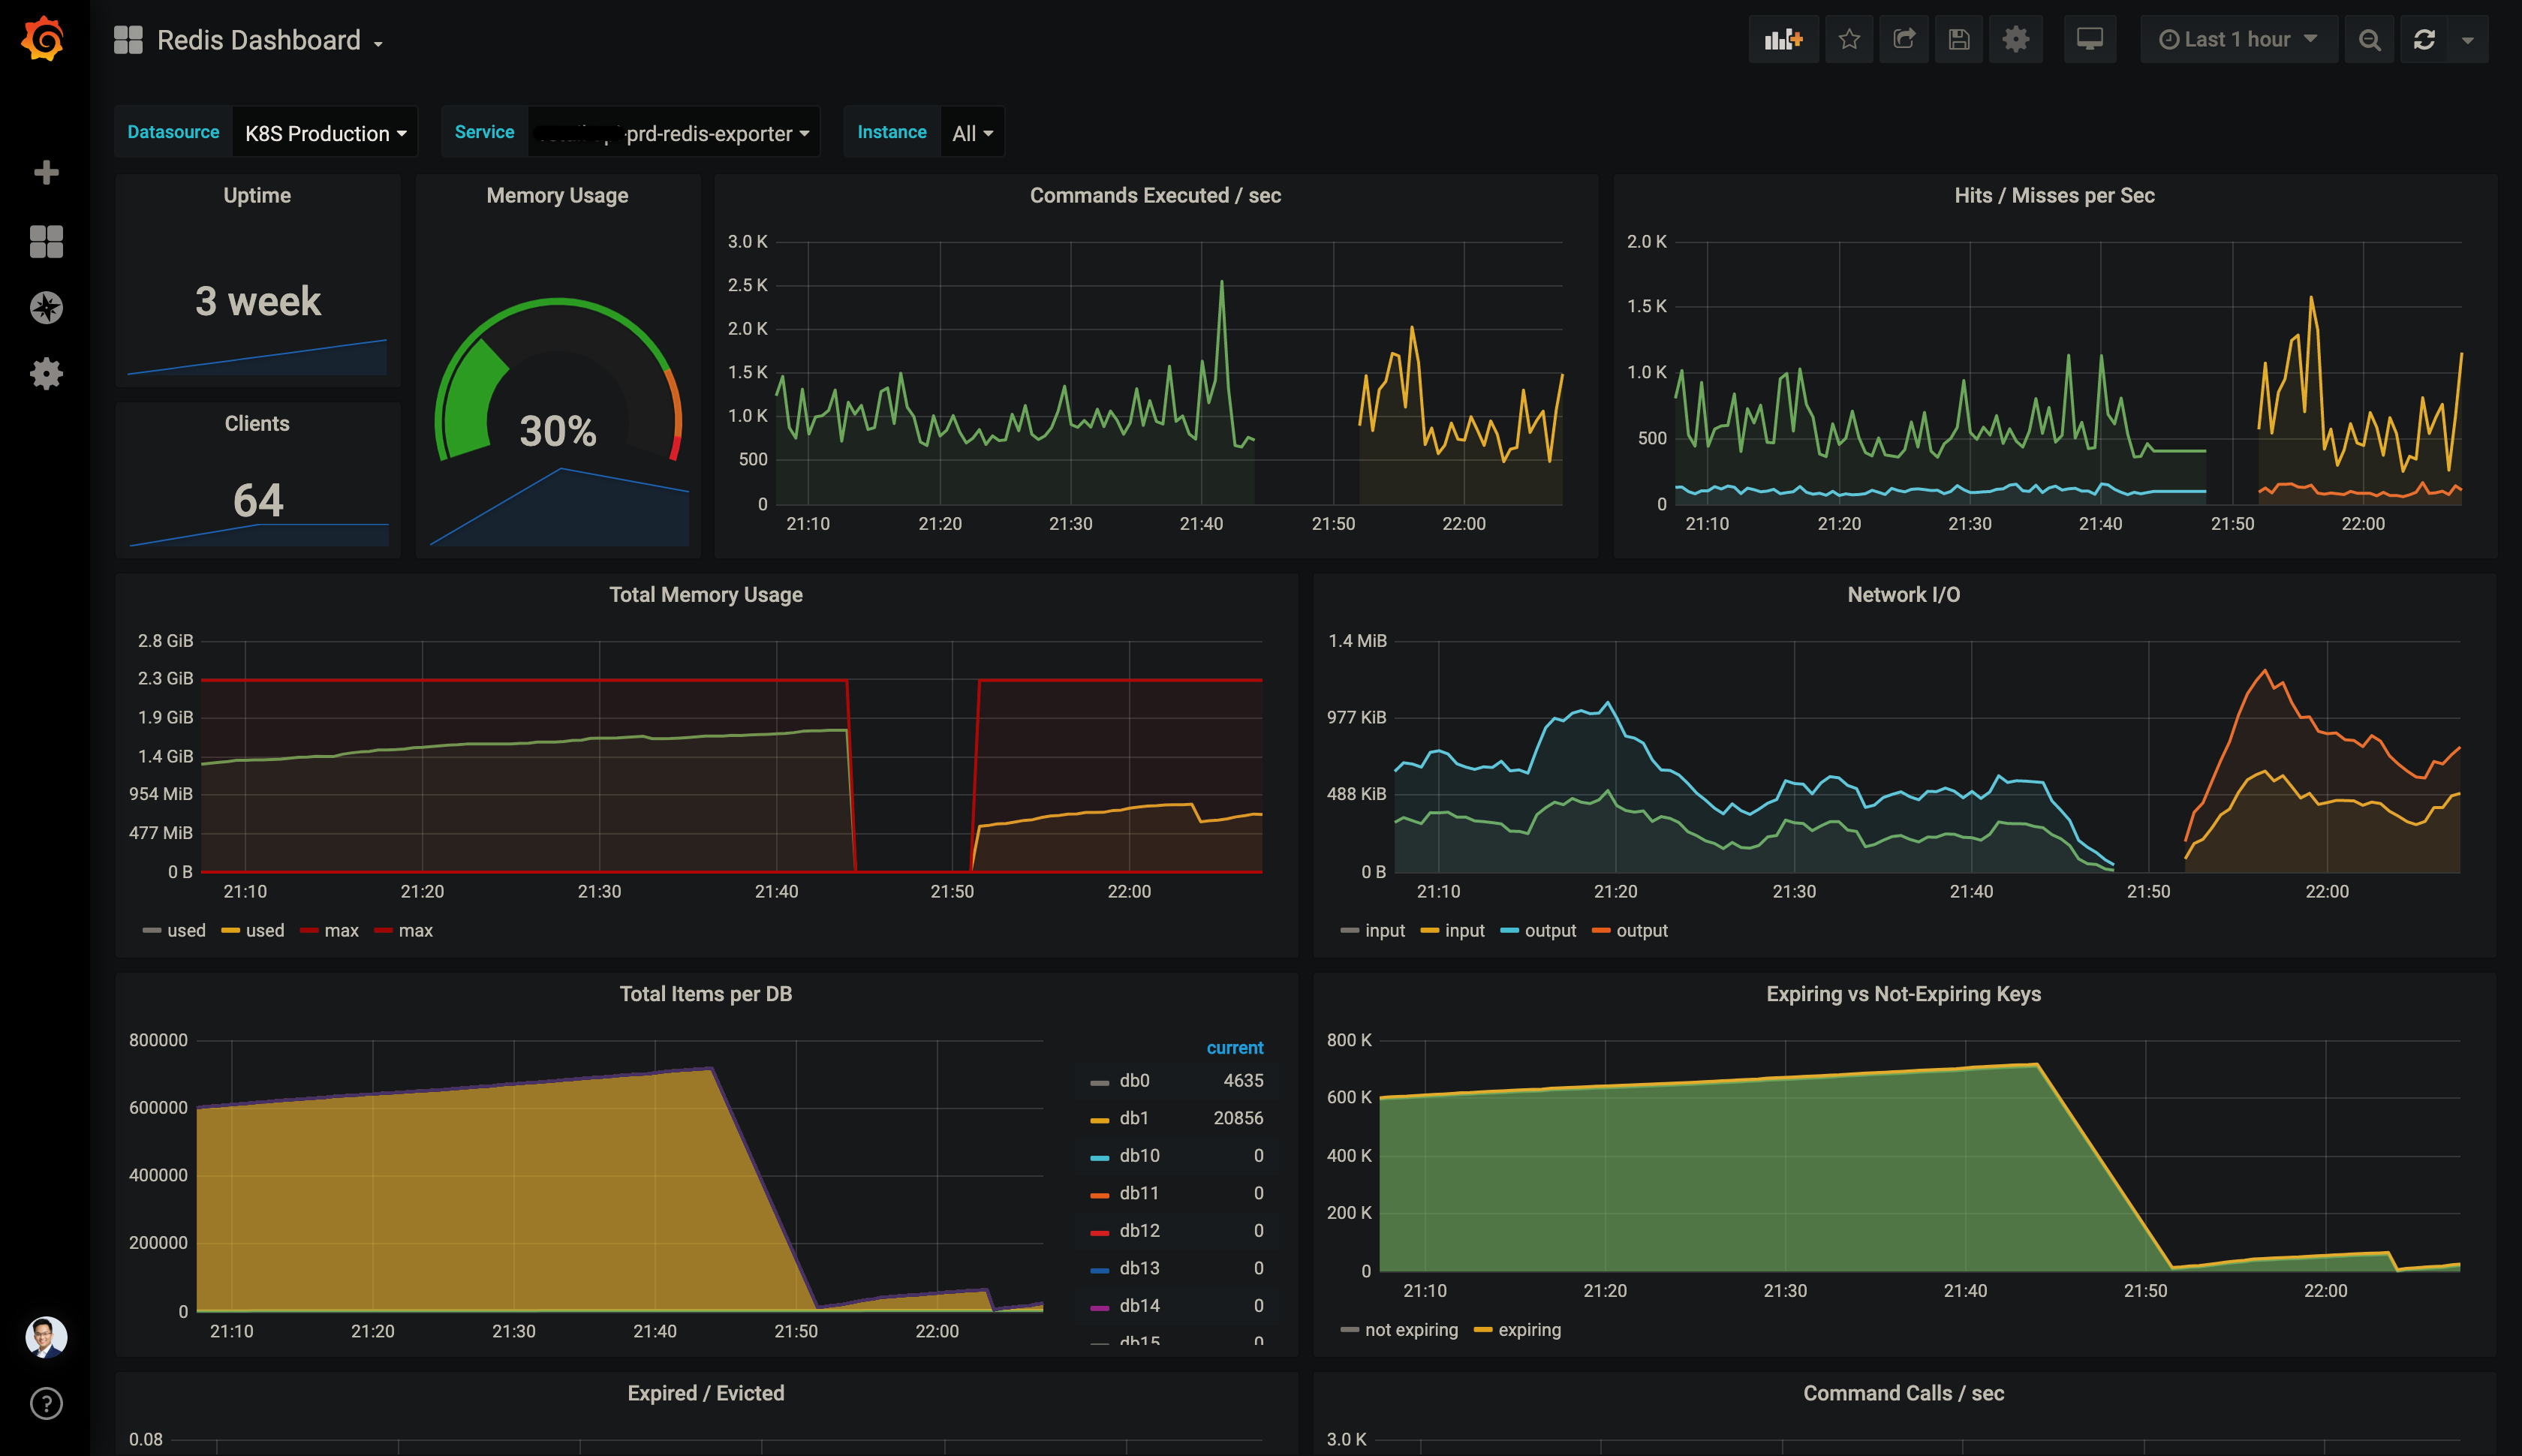
The dashboard is available here, as well as the raw JSON file.

About

đŸ“ˆEnhanced Grafana dashboard for Prometheus Redis Exporter, built for Kubernetes and Prometheus Operator.

Topics

Resources

Stars

Watchers

Forks

Releases

No releases published

Packages

No packages published