Demo project that intergrates OpenTelemetry-go SDK and exports to GCP and Prometheus using Otel-Collector
The repository explains what is OpenTelemetry, OpenTelemetry Collector, OTLP (Open Telemetry Protocol), and will proceed with a get started guideline to integrate opentelemetry in your Go project and export your telemetry data to different backends that are supported by the core Collector project and additional backends coming from the community contributions. The repository offers a mock microservice that makes use of collecting metrics and traces.
OpenTelemetry provides a single set of APIs, libraries, agents, and collector services to capture distributed traces and metrics from your application.
-
Metrics:
-
Everything from operating systems to applications generate metrics which, at the least, are going to include a name, a time stamp and a field to represent some value.
-
Most metrics will enable you to tell if a resource is alive or dead, but if the target is valuable enough you’ll want to be able to ascertain what is actually wrong with the system or going wrong.
-
-
Traces:
- With so many application interdependencies these days, these operations will typically involve hops through multiple services (so called spans Traces, then, add critical visibility into the health of an application end-to-end.
-
Logs:
- What’s more, logs tend to give more in-depth information about resources than metrics. So, if metrics showed the resource is dead, logs will help tell you why it died.
Explanation of Traces, Metrics, Logs
-
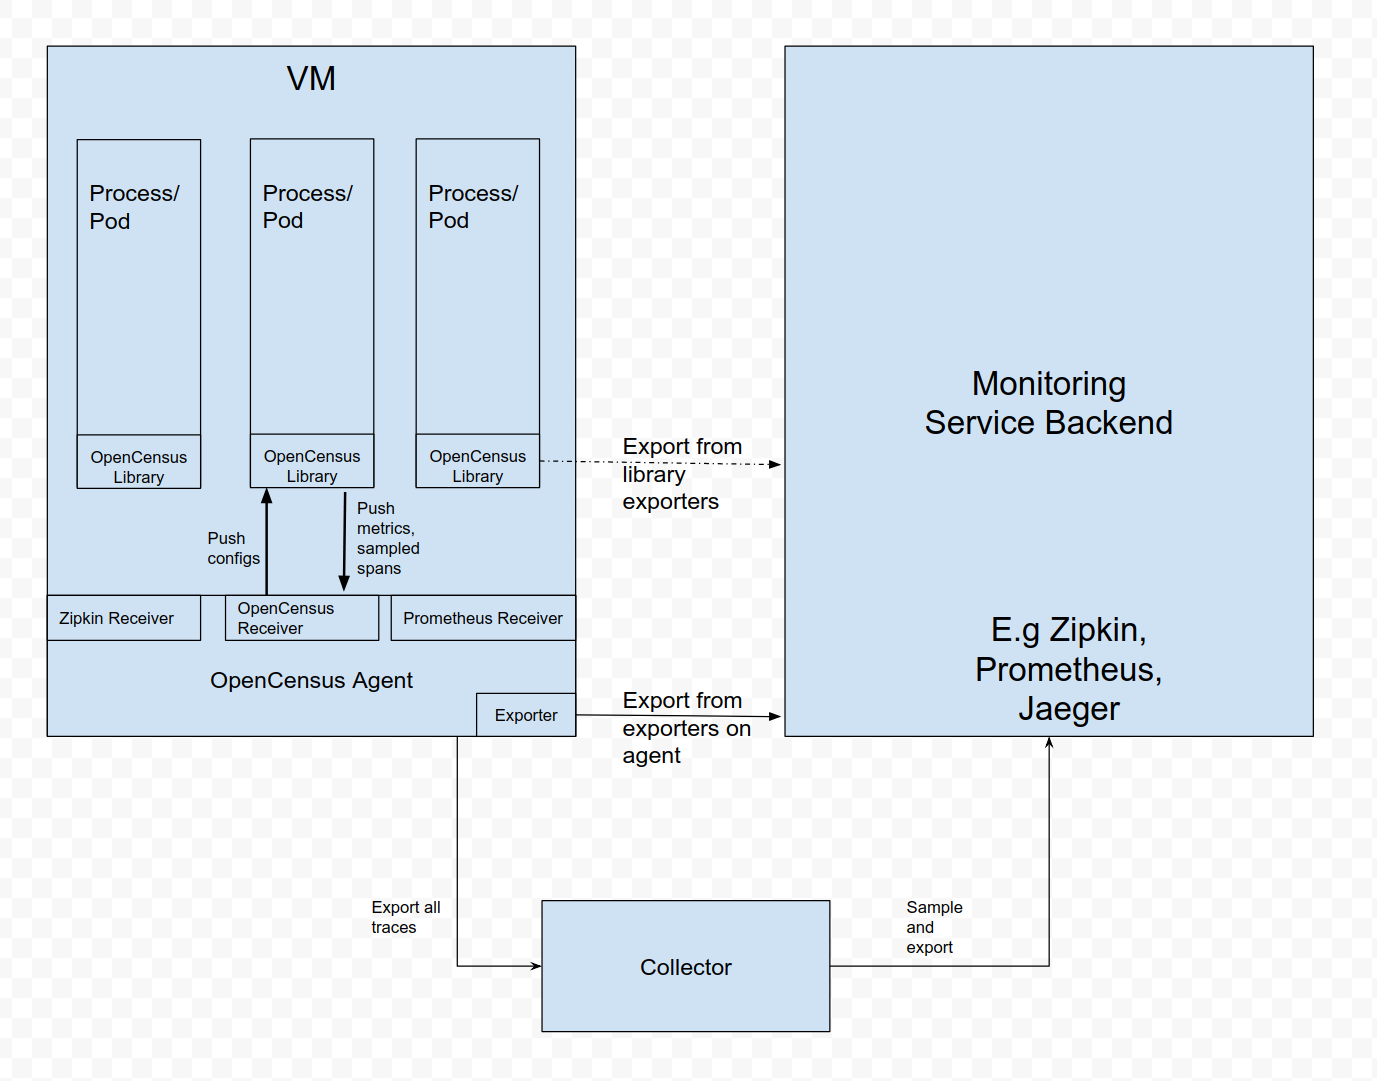
The OpenTelemetry Collector offers a vendor-agnostic implementation on how to receive, process, and export telemetry data. In addition, it removes the need to run, operate, and maintain multiple agents/collectors in order to support open-source telemetry data formats (e.g. Jaeger, Prometheus, etc.) sending to multiple open-source or commercial back-ends.
-
OpenTelemetry Collector is an executable that allows to receive telemetry data, optionally transform it and send the data further.
- The name might be misleading that this collector offer directly exporting data in OpenTelemetry format; however, this is not the case but it is possible through OTLP exporters and receievers.
- This is the protocol format that telemetry data could be collected in and then exported to a collector that has a receiver that understands this protocol format and could translate it to other backends like Prometheus, Jaeger, GCP.
-
To date, two open-source projects have dominated the cloud-native telemetry landscape: OpenTracing and OpenCensus—each with its own telemetric standard and its own substantial community. In a commendable spirit of cooperation, however, the two projects have decided to converge in order to achieve an important mission: a single standard for built-in, high-quality cloud-native telemetry.
-
Essentially OpenTelemetry converges the best of both projects into a single standard around which the entire cloud-native development community can rally.
Blog Explaning What Exactly is OpenTelemetry
- Using just vanilla OpenTelemetry to export to multiple backends would require the usage of various exporters that are vendor specific which means more code, more dependencies, and high risk of breaking your project when OpenTelemetry updates their API but the vendor specific exporter is unchanged. (The reason this repo came to existance was a trial to integrate exporting OpenTelemetry data to Google Cloud Tracing and this ended in failure after the poorly maintained GCP OpenTelemetry exporter was dependent on old version of OpenTelemetry SDK)
-
There are two ways to run the collector as:
-
An Agent that exposes different receivers for each backend and then through a single exporter exports to another collector and this collector then sends to multiple exporters. (This uses fewer resources at data sending stage and allows to deploy multiple collectors with more complexity.)
-
The other way is by deploying a standalone collector service that exposes a receiever with a specific protocol that collects all data exported data then translates this data to the declared exporters (Backends). (This uses more resources at data sending stage and allows only on collector but it is easier to setup and is suitable for small-medium scale projects.)
-
-
It might be confusing the usage of the word collector. The first essentially uses a collector instance as an agent that communicates to one or multiple collector instance as collectors. Second architecture directly uses a collector instance for the purpose of collecting and directly exporting to multiple backends.
In depth explanation of the Architecture
-
The Collector supports several popular open-source protocols for telemetry data receiving and sending as well as offering a pluggable architecture for adding more protocols.
-
Data receiving, transformation and sending is done using Pipelines. The Collector can be configured to have one or more Pipelines. Each Pipeline includes a set of Receivers that receive the data, a series of optional Processors that get the data from receivers and transform it and a set of Exporters which get the data from the Processors and send it further outside the Collector. The same receiver can feed data to multiple Pipelines and multiple pipelines can feed data into the same Exporter.
-
Pipeline defines a path the data follows in the Collector starting from reception, then further processing or modification and finally exiting the Collector via exporters.
-
Pipelines can operate on 2 telemetry data types: traces and metrics. The data type is a property of the pipeline defined by its configuration. Receivers, exporters and processors used in a pipeline must support the particular data type otherwise ErrDataTypeIsNotSupported will be reported when the configuration is loaded.
-
A pipline configuration follows this structure:
service: pipelines: # section that can contain multiple subsections, one per pipeline traces: # type of the pipeline receivers: [opencensus, jaeger, zipkin] processors: [tags, tail_sampling, batch, queued_retry] exporters: [opencensus, jaeger, stackdriver, zipkin] -
The used receivers,processors,exporters are declared above the service in the given format:
receivers: opencensus: endpoint: "0.0.0.0:55678" exporters: prometheus: endpoint: "0.0.0.0:8889" processors: batch: -
Multiple piplines could be declared in the same collector:
service:
    pipelines:
        traces:
            receivers: [opencensus]
            exporters: [logging]
            processors: [batch, queued_retry]
        metrics:
            receivers: [opencensus]
            exporters: [logging,prometheus]
- Receivers typically listen on a network port and receive telemetry data. Usually one receiver is configured to send received data to one pipeline, however it is also possible to configure the same receiver to send the same received data to multiple pipelines. This can be done by simply listing the same receiver in the “receivers” key of several pipelines.
- When prometheus is used as a receiver it used as a drop-in replacement to scrape the services declared under it just as if it is declared inside of a prometheus.yml file.
-
Exporters typically forward the data they get to a destination on a network (but they can also send it elsewhere, e.g “logging” exporter writes the telemetry data to a local file).
-
Exporter is basically the backend you are trying to export to. Exporters are either Metrics, Traces, or Both.
    Supported trace exporters (sorted alphabetically):
        Jaeger
        OpenCensus
        OTLP
        Zipkin

    Supported metric exporters (sorted alphabetically):
        OpenCensus
        Prometheus
        OTLP

    Supported local exporters (sorted alphabetically):
        File
        Logging
- Each exporter have different configuration but follows the same declaration language. Exporters in Depth
-
The offical contributions package includes support to additional exporters and receivers.
-
To use the contribution additional exporters:
-
Change the OTELCOL_IMG=otel/opentelemetry-collector-contrib:latest in .env
-
in the otel-collector-config.yaml file add your newly declared exporters and check their configuration settings from the github repo
-
- This part is broken into 3 parts:
-
This file is where the collector pipelines are declared.
-
A full Collector file that has an OTLP(open-telemetry protocol) reciever, Prometheus and Stackdriver Exporter, Some processors and extensions, and one Metric and One Trace pipeline will look like this:
  receivers:
  otlp:
    endpoint: 0.0.0.0:55678

exporters:
  prometheus:
    endpoint: "0.0.0.0:8889"
    namespace: promexample
    const_labels:
      label1: value1

  stackdriver:
    project: project-id-here
    metric_prefix: prefix
    number_of_workers: 3
    skip_create_metric_descriptor: true

processors:
  batch:
  queued_retry:

extensions:
  health_check:
  pprof:
    endpoint: :1888
  zpages:
    endpoint: :55679

service:
  extensions: [pprof, zpages, health_check]
  pipelines:
    traces:
      receivers: [otlp]
      exporters: [logging,stackdriver]
      processors: [batch, queued_retry]
    metrics:
      receivers: [otlp]
      exporters: [logging,prometheus]
-
This is a docker-compose file that declares
- Collector
- Your service
- Used exporters i.e Prometheus, Jaeger
-
NOTES:
- Prometheus needs a prometheus config file to be loaded so be sure to declare such a file.
- a .env file is needed with the docker image:tag of the collector and other required arguments.
- Stackdriver requires GOOGLE_APPLICATION_CREDENTIALS environment variable to
be set inside your collector container. To do so, load a local volume
internally and set an environment variable with the internal location.
- This is an important step, to get your GOOGLE_APPLICATION_CREDENTIALS Check: Google App Credentials
-
In your main.go of your application declare your exporter set with the address of your collector(Reciever) address. This address should be passed in the docker-compose file.
import ( "go.opentelemetry.io/otel/exporters/otlp" ) collectorAddr, ok := os.LookupEnv("OTEL_RECIEVER_ENDPOINT") if !ok { collectorAddr = otlp.DefaultCollectorHost + ":" + string(otlp.DefaultCollectorHost) } exporter, err := otlp.NewExporter(otlp.WithAddress(collectorAddr), otlp.WithInsecure()) -
For tracing you can then use this exporter to set a global trace provider.
-
Before running, if you are using stackdriver exporter be sure to change the credentials volume mounting in the docker-compose file i.e
/Users/zeyad/gs.json:/etc/gs.json -
Move to dev folder
cd /dev -
Run
docker-compose upcommand. -
After the containers are up, run
cd ../internal/sqlfilesand thenmigrate --source=file://. --database=postgres://postgres:roottoor@localhost:5432/backend\?sslmode=disable up- migrate is an sql migration tool that sets the postgres DB with the scheme
and the tables.
- Check /internal/sqlfiles/README.md for details on downloading sql migration tool
- migrate is an sql migration tool that sets the postgres DB with the scheme
and the tables.
-
If every thing is successful you will start seeing your stats showing in your deployed exporters.
- for this example:
- Prometheus at: http://localhost:9090
- Google Cloud Tracing at: https://console.cloud.google.com/traces
- for this example:
-
This project serves as an example of a Microservice that holds the current version for different applications. It is thought of as a service that will be queried by other services to get latest information about a specific application or about itself.
-
The application stores its information primarly in postgres with a middle redis cache layer.
-
The application is made to showcase OTEL Tracing and Metrics functionalities.
- Tracing entry point is set in the Telemetry middlware where a span is created and the context is propagated all the way until all service has and the stores finished their queries.
- Metrics depend on 4 different instruments, 2 of which are set in the MiddleWare to capture traffic count and weight. The other 2 are part of the service and stores where errors are counted and response times are measured.
-
api package:
- api.go:
- Where the routes are added to router and also the Middleware for Tracing and Metrics collection is declared.
- versionapi.go:
- Where the endpoints are declared and their respective handlers are initialized by making calls to the underlying (version) service.
- api.go:
-
cmd/backend package:
- main.go:
- Initializes all the services,stores,api,and http server
- telemetry.go:
- Intializes the OTEL exporter for traces and the pusher for metrics and sets both in the global providers.
- main.go:
-
dev package:
- contains files related with docker-compose, environment variables, requests file to test your server endpoints.
-
version package:
-
store package:
- contains two declarations of the store interface in the version service.
- redisstore is used as a cache layer
- postgres store is the main store
- contains two declarations of the store interface in the version service.
-
service.go:
- contains the structure of the service, declration of the structs it depends on, and the service methods.
-
version.go:
- contains the declaration of the Application struct.
-
-
From exporter-side:
-
Per config package of OPTL sdk/trace
-
// DefaultMaxAttributesPerSpan is default max number of attributes per span
DefaultMaxAttributesPerSpan = 32
// DefaultMaxLinksPerSpan is default max number of links per span
DefaultMaxLinksPerSpan = 32```
-
-
From examples found on open-telemetry go repository on github:
- use sdktrace.AlwaysSample sampler to sample all traces.
- In a production application, use sdktrace.ProbabilitySampler with a desired probability.
-
-
From collector-side:
-
So OpenTelemetry metrics api has 3 instruments to report metrics and summarized they are
-
There are three instruments you can use in OpenTelemetry, each defined by the method you call to send a metric event. They are:
-
Counters, which you Add a value to. These are good for values that you'd like to think of as a rate, or changes in a quantity.
-
Gauges, which you Set the value of. You can think of these as either a car's odometer (a monotonic gauge, it never decreases) or a car's speedometer (a non-monotonic gauge, as it can go up and down.)
-
Measures, to which you Record a value. These are useful to build histograms or summaries, metric projections that let you calculate averages of many values. Understanding Metrics in OPTL
-
RED, USE, 4 Golden Signals for collecting Metrics
- We choose RED for this specific demo as it targets mostly metrics related with APIs rather than underlying Infrastructure where USE would be a better fit.
-